Wisconsin Latino Family and Youth Study: Brown County Demographic Snapshot
Total Latino Population and its Growth over Time
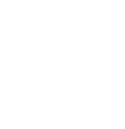
By 2020 the Latino population of Brown County had increased more than seventeen-fold since the 1990 Census, and its share of the county population was more than ten times larger than 30 years prior. Since 2000, the total population of Brown County has increased by 19% while the Latino population has more than tripled; the increase among Latinos has accounted for more than 40% of the county’s total gain in population during that time.
| 1990 Census | 2000 Census | 2010 Census | 2020 Census | |||||
| Population | Number | Percent | Number | Percent | Number | Percent | Number | Percent |
| Total | 194,594 | 226,778 | 248,007 | 268,740 | ||||
| Latino | 1,525 | 0.8% | 8,698 | 4.0% | 17,985 | 7.3% | 26,216 | 9.8% |
Municipalities with Highest Percentages of Latino Residents, Brown County, 2020
| Municipality | Total Population | Latino Population | Pct. Latinos | Share of County Latino Population |
| Green Bay city | 107,395 | 19,220 | 17.9% | 73.3% |
| Bellevue village | 15,935 | 1,740 | 10.9% | 6.6% |
| Wrightstown town | 2,578 | 204 | 7.9% | 0.8% |
| Wrightstown village | 2,895 | 183 | 6.3% | 0.7% |
| Morrison town | 1,689 | 105 | 6.2% | 0.4% |
| Allouez village | 14,156 | 867 | 6.1% | 3.3% |
| Ashwaubenon village | 16,991 | 765 | 4.5% | 2.9% |
| De Pere city | 25,410 | 1,067 | 4.2% | 4.1% |
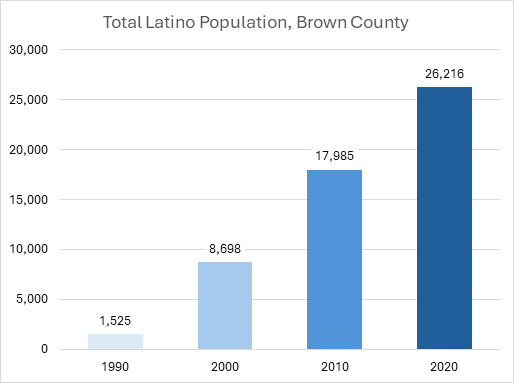
Based on the 2020 Census results, more than one in six residents of Green Bay identified as of Latino origin. Nearly three-fourths of the county’s Latinos live in the city, with most of the balance in seven other municipalities.
Latino Population by Census Block, Brown County: 2020
Age and Sex Patterns
Population by Five-Year Age Groups, Non-Latino and Latino Population, Brown County, 2020
Population by Five-Year Age Groups, Non-Latino and Latino Population, Brown County, 2020
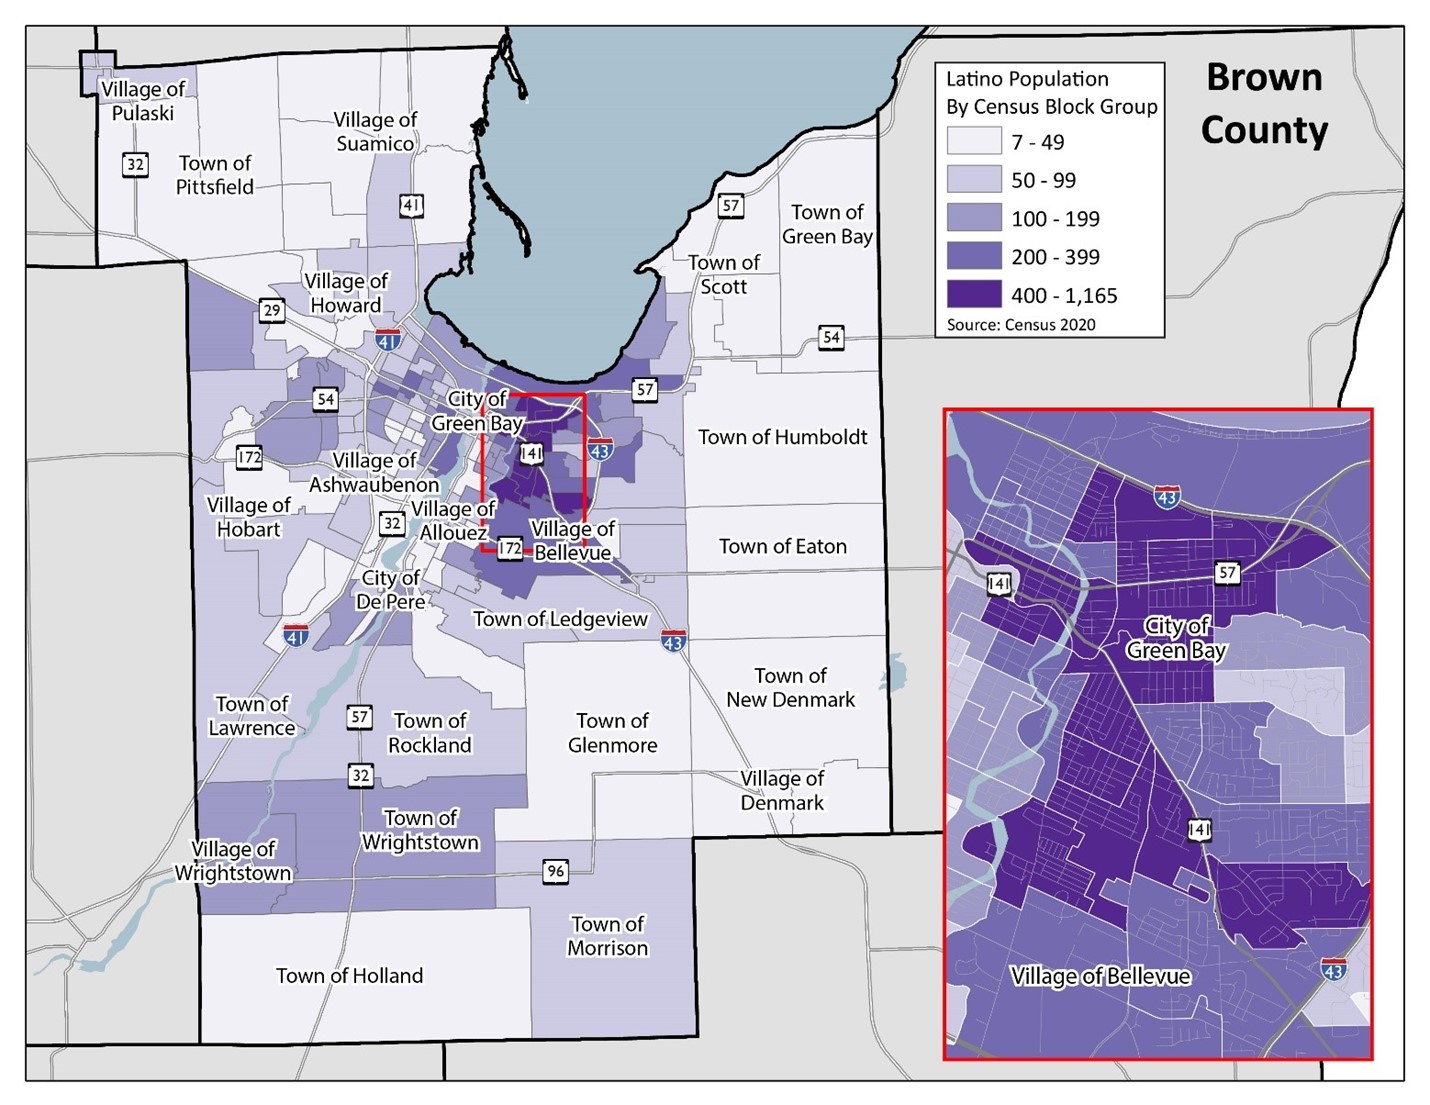
Comparing the age structure of Brown County’s non-Latino and Latino populations reveals the relative youth of the Latino population. In 2020:
- Among non-Latinos 24% were in the 0-19 years age range, among Latino’s 43% were ages 0-19.
- Among non-Latinos 32% of the population were ages 20-44, among Latinos 38% were 20-24.
- Among non-Latinos 27% were in the 45-64 age range, among Latinos 15% were 45-64.
- Among non-Latinos 17% were ages 65 and older, among Latinos 4% were ages 65 and older.
The median age for the county’s total population in 2020 was 37.9, while the median age of the Latino population was significantly lower at 23.5.
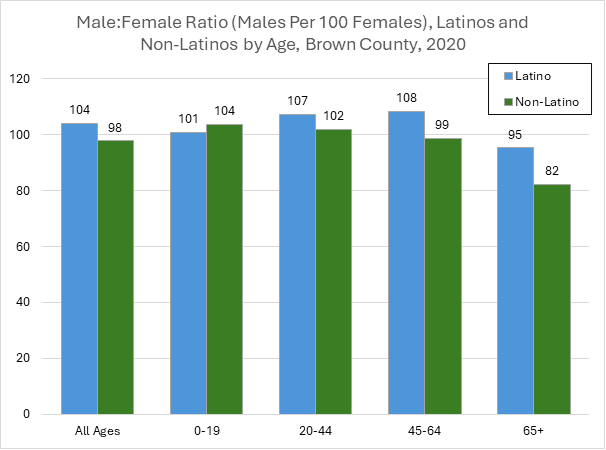
The male-to-female ratios of Latinos were higher than the corresponding ones for non-Latinos for all age groups except for those 0-19. For the total population in Brown County the ratio of Latino males-to-females is 104 to 100; among non-Latinos, there were fewer men than women, 98 for every 100. High male-to-female ratios were particularly evident in the prime working age categories of 20-44 and 45-64.
Housing and Household Patterns
Given that the Latino population is younger, it is not surprising that the proportion of households who were renters is much higher among Latino-headed households than among non-Latino households. In Brown County, nearly two-thirds of Latino-headed households rent as compared to only one-third of non-Latino households.
Latino and Non-Latino Households by Owner/Renter Status, Brown County, 2020
| 2010-2014 Estimate | 2020 | |||||||
| Latino Households | Non-Latino Households | Latino Households | Non-Latino Households | |||||
| Tenure | Count | Percent | Count | Percent | Count | Percent | Count | Percent |
| Owner Occupied | 1,384 | 33% | 64,218 | 67% | 2,604 | 38% | 66,966 | 66% |
| Renter Occupied | 2,769 | 67% | 31,334 | 33% | 4,334 | 62% | 34,252 | 34% |
With a higher share of renters than owners, Latinos also tended to be more likely to live in multi-family rather than single-family housing units. In Brown County, 47% of Latino-headed households lived in multi-family housing (structures with 2 or more units), compared to only 29% of non-Latinos.
Latino and Non-Latino Households by Housing Type, Brown County, 2020
| 2010-2014 Estimate | 2018-2022 Estimate | |||||||
| Units in Structure | Latino Housing Units | Non-Latino Housing Units | Latino Housing Units | Non-Latino Housing Units | ||||
| Count | Percent | Count | Percent | Count | Percent | Count | Percent | |
| 1 | 1,925 | 46% | 68,535 | 72% | 3,628 | 53% | 75,826 | 71% |
| 2 to 4 | 809 | 19% | 8,922 | 9% | 1,320 | 19% | 8,341 | 8% |
| 5 to 9 | 893 | 22% | 6,825 | 7% | 899 | 13% | 8,225 | 8% |
| 10 or more | 382 | 9% | 10,215 | 11% | 674 | 10% | 12,837 | 12% |
| Mobile home | 140 | 3% | 1,050 | 1% | 307 | 4% | 1,109 | 1% |
The Latino population tends to live in family households at rates greater than the non-Latino population. In Brown County, nearly 30% of Latino households were married couples with children, and another nearly one-quarter were single parents with children. In contrast, non-Latino family households tend primarily to be made up of married couples without children in the home. This distinction is also influenced by non-Latino households being older in general. Many of these non-Latino households were likely made up of “empty nesters” whose children have grown and moved away and of single people living alone.
Latino and non-Latino Households by Type, Brown County, 2010-2014 & 2020
| 2010-2014 Estimate | 2020 | |||||||
| Household Type | Latino Households | Non-Latino Households | Latino Households | Non-Latino Households | ||||
| Count | Percent | Count | Percent | Count | Percent | Count | Percent | |
| Family households: | 3,405 | 82% | 61,569 | 64% | 5,161 | 74% | 63,054 | 62% |
| Married couples, no children | 361 | 9% | 28,672 | 30% | 1,033 | 15% | 30,796 | 30% |
| Married couples, with children | 1,886 | 45% | 19,440 | 20% | 2,010 | 29% | 17,830 | 18% |
| Single parent with children | 974 | 23% | 8,505 | 9% | 1,546 | 22% | 8,334 | 8% |
| Other families | 184 | 4% | 4,952 | 5% | 572 | 8% | 6,094 | 6% |
| Nonfamily households: | 748 | 18% | 33,983 | 36% | 1,777 | 26% | 38,164 | 38% |
| Householder living alone | 471 | 11% | 27,400 | 29% | 1,219 | 18% | 30,590 | 30% |
| Householder not living alone | 277 | 7% | 6,583 | 7% | 558 | 8% | 7,574 | 7% |
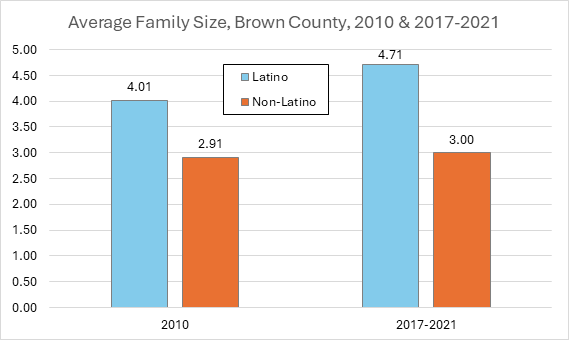
In part because of their relative youth Latinos families were more likely to have children living at home, their average family size has tended to be larger than that of non-Latinos. In Brown County, the average Latino-headed family has 4.7 members, while non-Latino families average 3. Latino family sizes grew between then 2010 Census and the 2021 5-year estimate.
Immigration and Countries of Origin
In Brown County, 43% of Latino residents were born in Wisconsin, while 21% were born in another state besides Wisconsin. Only 29% were estimated to have been born outside the U.S.
Latinos by Place of Birth and Nativity, Brown County, 2010-2014 & 2018-2022
| 2010-2014 Estimate | 2018-2022 Estimate | |||
| Place of Birth | Count | Percent | Count | Percent |
| Born in Wisconsin | 7,670 | 40% | 10,993 | 43% |
| Born in another state in the U.S. | 3,347 | 17% | 5,418 | 21% |
| Native; Born outside the U.S.* | 1,088 | 6% | 1,618 | 6% |
| Foreign Born | 7,310 | 38% | 7,334 | 29% |
*Includes Latinos born in Puerto Rico, and those born in other countries who have at least one U.S. parent
Nearly three out of four Latinos in Brown County identified Mexico as their country of heritage or origin, and eleven percent reported Puerto Rico. Other Central and South American countries and some Caribbean nations (e.g., Cuba, the Dominican Republic) accounted for the balance.
Latino Country/Regions of Heritage, Brown County, 2010-2014 & 2018-2022
| 2010-2014 Estimate | 2018-2022 Estimate | |||
| Country/Region | Count | Percent | Count | Percent |
| Mexico | 14,043 | 72% | 18,722 | 74% |
| Puerto Rico | 1,886 | 10% | 2,894 | 11% |
| Central American | 1,649 | 8% | 1,664 | 7% |
| South American | 416 | 2% | 763 | 3% |
| Others | 1,421 | 8% | 1,320 | 5% |
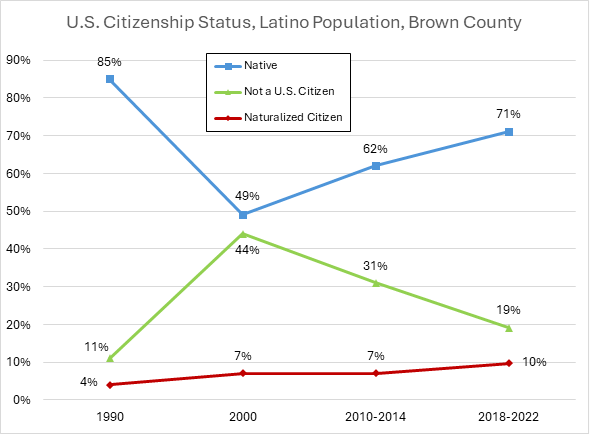
Immigration to Brown County during the 1990s was robust, producing a sharp rise in the number and percentage of non-U.S. citizen Latinos, and a consequent decline in the percentage of native U.S. citizen Latinos (even though numeric increases among U.S. citizen Latinos were strong). However, following 2020, the percentage of native U.S. Latino citizens increased, with a resulting decline in the share of non-U.S. citizens.
Language Ability
In Brown County, 35% of Latino residents reported speaking only English at home, while 64% report speaking Spanish as their primary language at home. Among those who use Spanish at home, three out of four reported also speaking English “very well” or “well.”
Language Spoken at Home, and Self-Identified English Ability,
Latino Population, Brown County, 2010-2014 & 2018-2022
| 2010-2014 Estimate | 2018-2022 Estimate | |||
| Language Spoken at Home | Count | Percent | Count | Percent |
| English only | 4,154 | 25% | 7,917 | 35% |
| Spanish | 12,414 | 74% | 14,471 | 64% |
| Other language | 94 | 1% | 80 | <1% |
| Of those that speak Spanish at home, they also report that they: | ||||
| Speak English “very well” | 6,045 | 49% | 7,112 | 49% |
| Speak English “well” | 2,453 | 20% | 3,577 | 25% |
| Speak English “not well” | 2,340 | 19% | 2,859 | 20% |
| Speak English “not at all” | 1,576 | 12% | 923 | 6% |
Note: Universe for this measure is population 5 years of age and older
Labor Force
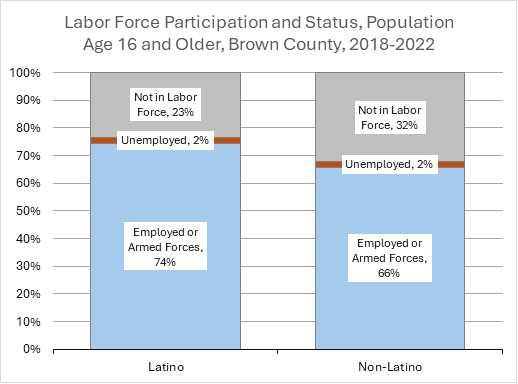
Labor force participation rates in Brown County were higher for the Latino population at 74%, compared to 66% for the non-Latino population. Non-Latinos in Brown County were relatively older, and thus less likely to be in the labor force. State-wide, Latinos’ corresponding labor force percentages were 70% employed, 3% unemployed, and 27% not in the labor force.
Employment Status by Sex for Latino Population 16 years and over,
Brown County, 2018-2022 Estimates
| Total | Male | Female | ||||
| Employment Status | Count | Percent | Count | Percent | Count | Percent |
| Employed or Armed Forces | 11,882 | 74% | 6,657 | 79% | 5,225 | 69% |
| Unemployed | 384 | 2% | 257 | 3% | 127 | 2% |
| Not in Labor Force | 3,742 | 23% | 1,541 | 18% | 2,201 | 29% |
Unemployment rates are generally measured as the unemployed share of the civilian labor force, or those that are actively looking for work (it is distinct from the unemployed percentage of all persons age 16 years and over, shown above). In Brown County the unemployment rate for Latinos was 3.1% compared to 2.9% for the non-Latino population.
Among Latinos working in Brown County, 30% reported being employed in manufacturing. Statewide, the proportion of Latinos in manufacturing was only 23%.
Top Five Industries of Employment for Latinos, Brown County, 2017-2021 Estimate
| Industry | Count | Percent |
| Manufacturing | 3,314 | 30% |
| Educational services, and health care and social assistance | 1,417 | 13% |
| Arts, entertainment, and recreation, and accommodation and food services | 1,340 | 12% |
| Retail trade | 1,078 | 10% |
| Professional, scientific, and management, and administrative, and waste management services | 894 | 8% |
Education
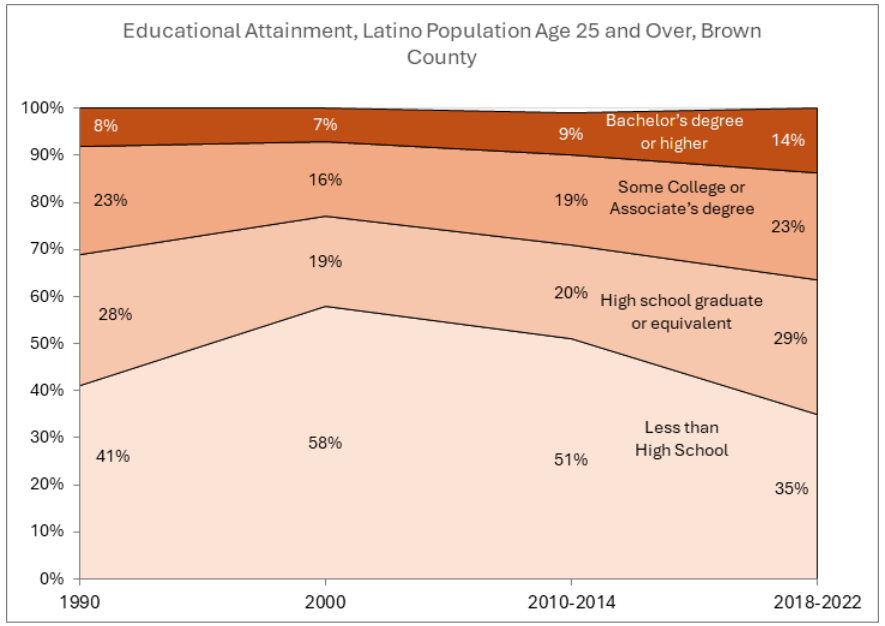
Over the past 30 years, the educational attainment of Latinos in Brown County has been reflective of the pattern of recent arrivals moving into the county. Brown County’s Latino population nearly quintupled from 1990 to 2000; many were foreign-born non-U.S. citizens (see graph in “Immigration and Countries of Origin” section earlier). During that time, the share of those who had less than a high school education rose from 41% in 1990 to 58% in 2000. In the subsequent 20 years, educational attainment increased among Brown County’s Latino population . The proportion of Latinos without a high school diploma has fallen to 35%, while all other higher attainment categories have grown.
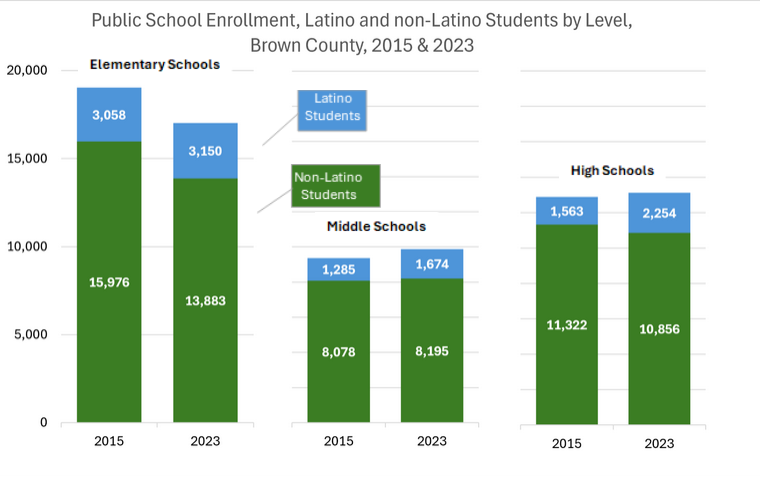
In terms of public-school enrollments in 2015-2023, the number of Latino students increased by nearly 100 at the elementary level, nearly 400 in middle schools, and nearly 700 in high schools. These increases helped to boost elementary enrollment and to sustain overall totals at the middle and high school levels as non-Latino enrollment declined.
Income and Poverty
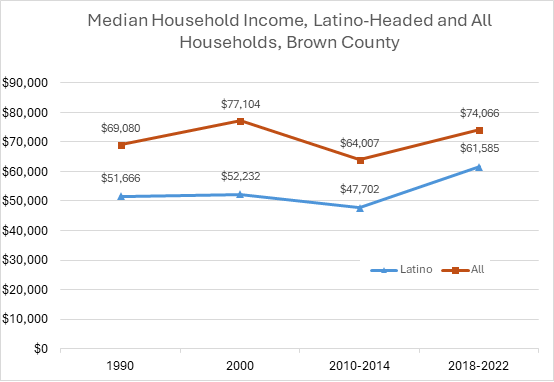
The median income for Latino households in Brown County has been consistently lower than that for all households. Latino household income was 75% that of all households in 1990 and dipped to 68% in 2000 (influenced by an influx of new immigrants in the 1990s). Latino income returned to 75% in the 2010-2014 period, and recently rose to 83% of the median income for all households in Brown County. Though median household incomes have increased relative to the non-Latino population, it is important to recall that Latino households tend to be larger that non-Latino households, so the income gap per-capita is larger.
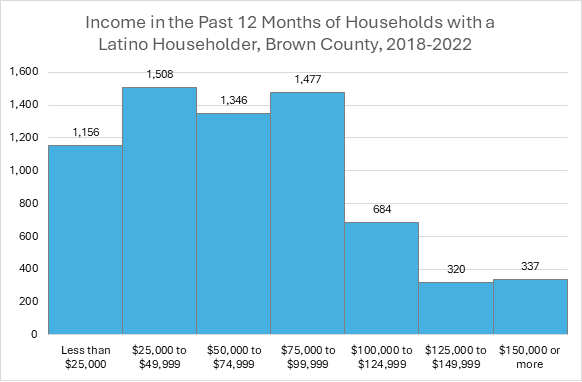
The incomes of Brown County’s Latino households were concentrated between $25,000 and $100,000; nearly two-thirds of households had incomes in this range. Roughly 17% of households had incomes below $25,000, and just under 20% had incomes of $100,000 or more.
Poverty Status by Family Type for Latino-Headed Families, Brown County, 2018-2022
| Latino Families | ||||
| 2010-2014 Estimate |
2018-2022 Estimate |
|||
| Household Type | Count | Percent | Count | Percent |
| Families with income in the past 12 months below poverty level: | 747 | 22% | 776 | 16% |
| Of those families in poverty: | ||||
| Married couple family | 381 | 51% | 412 | 53% |
| Male householder, no wife present | 59 | 8% | 128 | 16% |
| Female householder, no husband present | 307 | 41% | 236 | 30% |
The poverty rate for Latino families in Brown County was 16% during the 2018-2022 period, compared to 6% for all families in the county. Of Latino families with incomes below the poverty line, one-half were married-couple families with children, and three out of ten were female-headed households.
This report was produced at the UW Applied Population Lab with support from UW Extension. For any questions, please contact apl@dces.wisc.edu.
Data sources for this report include the 1990-2020 Decennial Censuses and the 5-Year American Community Survey Estimates from 2014 and 2022.