County Profiles
County Profiles, available exclusively to Extension colleagues with NetID login, contain data from public sources on each county in Wisconsin. Topics include demographics, health, employment, language, and economics.
Read More...
County Profiles, available exclusively to Extension colleagues with NetID login, contain data from public sources on each county in Wisconsin. Topics include demographics, health, employment, language, and economics.
Read More...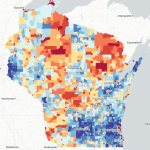
The Neighborhood Atlas, featuring the Area Deprivation Index, ranks census blocks based on socioeconomic disadvantage by aggregating 17 indicators related to income, education, employment, and housing quality. The Atlas can be a resource for precisely tailoring programs for areas where high levels of disadvantage may intersect with other needs.
Read More...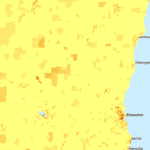
The Smart Location Database is designed to measure location efficiency—transportation costs and environmental impact, in particular. It includes more than 90 attributes summarizing characteristics such as housing density, diversity of land use, neighborhood design, destination accessibility, transit service, employment, and demographics.
Read More...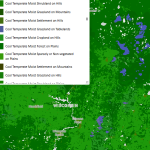
This resource, access to which is limited to account holders (sign up is free), brings together geospatial data coordinated by several Federal Agencies. Topics include ecosystems, geology, soils, climate, cultural resources, transportation, and many others.
Read More...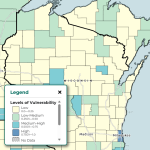
The Social Vulnerability Interactive (SVI) Map, a product of the CDC Agency for Toxic Substances and Disease Registry, displays vulnerability indices for four categories: socioeconomic status, household characteristics, racial and ethnic minority status, and housing type and transportation.
Read More...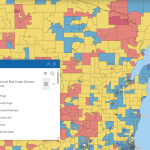
The Resilience Analysis and Planning Tool (RAPT) allows users to combine layers of community resilience indicators, infrastructure locations and hazard data. Users can visualize community resilience challenges to inform decisions around preparedness, mitigation, response and recovery.
Read More...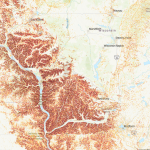
The USGS Landslide Inventory provides a comprehensive spatial database of documented landslides, including their locations, types, and movement characteristics.
Read More...
The CDC National Health and Nutrition Examination Survey (NHANES) gathers detailed demographic, health behavior, medical condition, and nutrition information. The survey is unique in that it includes examination data and laboratory tests.
Read More...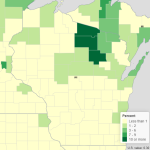
This resource offers a quick way to see the distribution of a number of variables from the 2022 USDA Census of Agriculture among the counties of Wisconsin.
Read More...
The Center on Rural Innovation (CORI) Economic Development tool allows users to create a custom dashboard of indicators focused on the strengths and weaknesses of the selected area’s economy.
Read More...