The UW-Madison Applied Population Lab offers a tremendous breadth of interactive demographic and socio-economic tools, analyses, and reports. Some of these are detailed in this Data Inventory, but APL provides many more than can be listed here.

The CDC National Health and Nutrition Examination Survey (NHANES) gathers detailed demographic, health behavior, medical condition, and nutrition information. The survey is unique in that it includes examination data and laboratory tests.
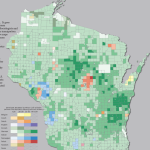
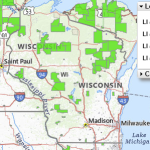
The data in the PLACES interactive tool is model generated by the Centers for Disease Control and Prevention (CDC) from various data sources. The map displays a comprehensive list of health related data from the county level down to the Census Tract level.
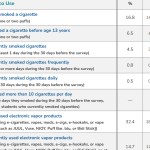
The CDC’s Youth Risk Behavior Surveillance System (YRBSS) monitors the prevalence of health-risk behaviors and experiences among U.S. high school students.
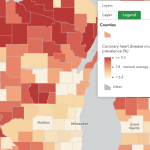
This website presents rankings by County across the U.S. of various health related topics in two categories: health factors, and health outcomes.
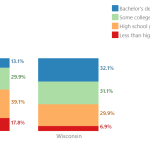
DataUSA is a public-private partnership leveraging U.S. Census and other public data using a flexible dashboard generator for geographies including state, county, and municipality, and Tribal area. Topics include employment, industry, education, income, housing, transportation, poverty, and health.
The DHS Open Data Portal provides an extensive list of data related to health and behavior including: birth and death rates, life expectancy, illness, insurance, public health, lead, mental health, and substance use.
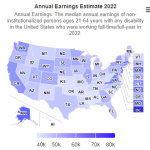
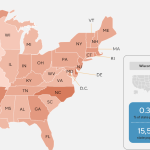
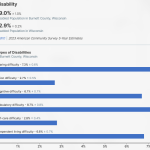
Disability Statistics is a state-level database designed to provide policy makers, advocates, journalists, and the public with access to demographic and socio-economic statistics on the non-institutionalized population of the U.S. with disabilities.
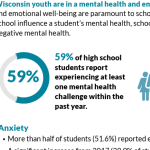
The Wisconsin Youth Risk Behavior Survey (YRBS) has been conducted every two years since 1993. The health-risk behaviors monitored include mental health, traffic safety, weapons and violence, suicide, tobacco use, alcohol and other drug use, sexual behavior, nutrition, and exercise.
EJScreen, the EPA’s Environmental Justice Screening and Mapping Tool is designed to highlight places that may have more exposure to health-impacting environmental risks and under-resourced or more vulnerable populations.
The Resilience Analysis and Planning Tool (RAPT) allows users to combine layers of community resilience indicators, infrastructure locations and hazard data. Users can visualize community resilience challenges to inform decisions around preparedness, mitigation, response and recovery.
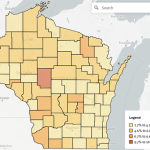
APL’s GetFacts is a tool for generating demographic profiles of Wisconsin Counties, County Subdivisions, or the State with a focus on population trends, health, housing, race and ethnicity, economics, or civil rights.
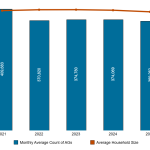
The Kids Count Data Center provides a convenient source of DHS, DPI, U.S. Census, and other data. Tables or maps for many socio-economic indicators that affect the lives of children and adults are available.
Data Interactives is a resource developed by UCLA to provide information about LGBT people in the U.S.
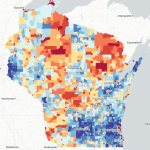
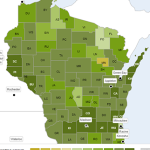
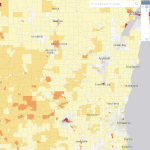
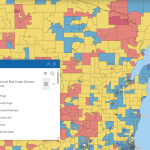
The Neighborhood Atlas, featuring the Area Deprivation Index, ranks census blocks based on socioeconomic disadvantage by aggregating 17 indicators related to income, education, employment, and housing quality. The Atlas can be a resource for precisely tailoring programs for areas where high levels of disadvantage may intersect with other needs.
In this document the UW-Extension Office of Access, Inclusion, and Compliance (OAIC) consolidates dozens of disparate federal and state data sources into a single, organized directory for rapid assessment.
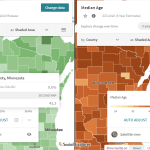
The Social Explorer, available with a UW NetID login, allows the user to access and map an extensive list of demographic, socio-economic, health, environmental, business, and election data sets.
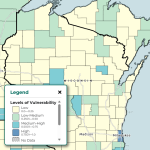
The Social Vulnerability Interactive (SVI) Map, a product of the CDC Agency for Toxic Substances and Disease Registry, displays vulnerability indices for four categories: socioeconomic status, household characteristics, racial and ethnic minority status, and housing type and transportation.
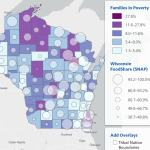
APL’s Wisconsin Food Security Project provides data to help identify food security strengths, risk factors, and gaps via socio-economic factors.
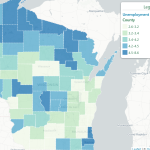
APL’s Wisconsin Risk and Reach Project assesses potential gaps between publicly funded programs and community risks especially as they relate to children and families.
The U.S. Census County Profiles offer a comprehensive and current socio-economic picture of each county in Wisconsin from economic, employment, and housing data to health, education, and demographics.
The U.S. DOT’s Fatality and Injury Reporting System Tool (FIRST) allows users to query both the Fatality Analysis Reporting System (FARS) and the Crash Report Sampling System (CRSS) using various attributes of crashes on the state’s roadways.
The USDA Food Access Research Atlas and associated mapping tools provide county-level data identifying low-access areas by measuring the number of various types of food stores or markets by county and showing access indicators for different populations.