National Risk Index for southern WI from the FEMA Resilience Analysis and Planning Tool.

FEMA Resilience Analysis and Planning Tool

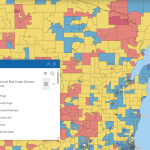
The Resilience Analysis and Planning Tool (RAPT) allows users to combine layers of community resilience indicators, infrastructure locations and hazard data. Users can visualize community resilience challenges to inform decisions around preparedness, mitigation, response and recovery.

Read More...
An example graph from the CORI Economic Development tool

CORI Economic Development Tool

The Center on Rural Innovation (CORI) Economic Development tool allows users to create a custom dashboard of indicators focused on the strengths and weaknesses of the selected area’s economy.

Read More...
Example graph from the Census of Agriculture data dashboard

Census of Agriculture Data Dashboard

The Census of Agriculture Data Dashboard is a quick source of state-level data from 2012, 2017, or 2022. The data topics are high-level and include data about land in farms and producer demographics such as age, gender, and race/ethnicity.

Read More...
Example map of broadband access in Door County WI

Broadband Resources

UW Extension’s Community Development Institute developed this comprehensive collection of data sources that are essential for communities to plan broadband implementations.

Read More...
US Bureau of Labor Statistics logo

Quarterly Census of Employment and Wages

The Bureau of Labor Statistics Quarterly Census of Employment and Wages is a highly reliable near-census of all jobs covered by unemployment insurance. The QCEW data is useful for determining county employment trends, identifying emerging job needs, targeting skills gaps, among other uses.

Read More...
An example of the data available on the DWD dashboards

DWD Data Dashboards

The Wisconsin Department of Workforce Development data dashboards provide comprehensive, localized economic and workforce data.

Read More...
An example of the data available on the US Census County Profiles site

US Census County Profiles

The U.S. Census County Profiles offer a comprehensive and current socio-economic picture of each county in Wisconsin from economic, employment, and housing data to health, education, and demographics.

Read More...
A screenshot of the Supply Chain Infrastructure Map

Supply Chain Infrastructure Map

This resource shows production by county of specialty crops in categories such as fruits, tree nuts, novel oilseeds, and small grains, and the infrastructure needed to move crops from fields to consumers.

Read More...
Screenshot of the Civic Opportunity map from the Civic Opportunity Dataset.

Civic Opportunity Dataset

Leveraging IRS data and information scraped from organization websites, this resource from Johns Hopkins University illustrates the landscape of civic opportunity by county.

Read More...