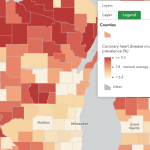
The data in the PLACES interactive tool is model generated by the Centers for Disease Control and Prevention (CDC) from various data sources. The map displays a comprehensive list of health related data from the county level down to the Census Tract level.
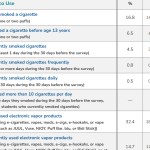
The CDC’s Youth Risk Behavior Surveillance System (YRBSS) monitors the prevalence of health-risk behaviors and experiences among U.S. high school students.
County Profiles, available exclusively to Extension colleagues with NetID login, contain data from public sources on each county in Wisconsin. Topics include demographics, health, employment, language, and economics.
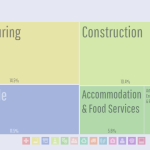
DataUSA is a public-private partnership leveraging U.S. Census and other public data using a flexible dashboard generator for geographies including state, county, and municipality, and Tribal area. Topics include employment, industry, education, income, housing, transportation, poverty, and health.
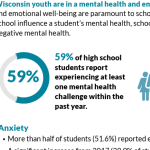
The Wisconsin Youth Risk Behavior Survey (YRBS) has been conducted every two years since 1993. The health-risk behaviors monitored include mental health, traffic safety, weapons and violence, suicide, tobacco use, alcohol and other drug use, sexual behavior, nutrition, and exercise.

The Kids Count Data Center provides a convenient source of Department of Health Services, Department of Public Instruction, U.S. Census, and other data. Tables or maps for many socio-economic indicators that affect the lives of children and adults can be generated and downloaded.
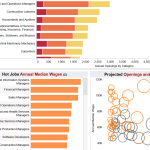
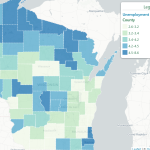
The Wisconsin Department of Workforce Development data dashboards provide comprehensive, localized economic and workforce data.
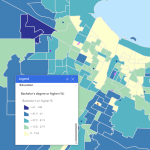
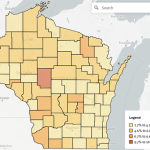
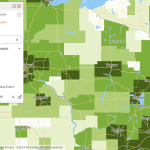
The EPD maps five categories of socioeconomic and demographic Census data at the County, County Subdivision, Tract, and Block Group levels, and includes a number of community assets for additional local context.
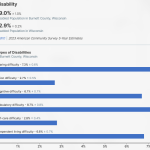
APL’s GetFacts is a tool for generating demographic profiles of Wisconsin Counties, County Subdivisions, or the State with a focus on population trends, health, housing, race and ethnicity, economics, or civil rights.
APL’s Hmong Chartbook is the most detailed information source available in regard to the Hmong/HMoob population of Wisconsin.
The Kids Count Data Center provides a convenient source of DHS, DPI, U.S. Census, and other data. Tables or maps for many socio-economic indicators that affect the lives of children and adults are available.
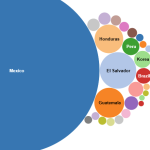
The Migration Data Hub provides comprehensive profiles and interactive maps detailing the demographics, geographic distribution, and socioeconomic characteristics of immigrant populations mostly at the state level, but some data is available at the county, and local levels.
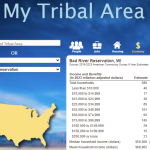
Finding data collected from Tribal Nation geographies can be challenging. This resource allows users to view statistics from the most current ACS aggregated and tabulated specifically to match the boundaries of the designated Tribal Geographies in Wisconsin.
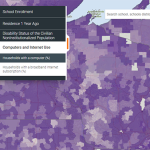
The ACS-ED interactive mapping tool allows the user to visualize socio-economic and demographic variables from the U.S. Census ACS by school district.
In this document the UW-Extension Office of Access, Inclusion, and Compliance (OAIC) consolidates dozens of disparate federal and state data sources into a single, organized directory for rapid assessment.
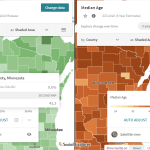
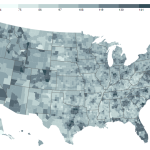
PolicyMap makes one of the most extensive lists of demographic and socio-economic variables accessible in one place—at nearly every level of geography imaginable. Current Census data exists alongside historical data of various types.
The Social Explorer, available with a UW NetID login, allows the user to access and map an extensive list of demographic, socio-economic, health, environmental, business, and election data sets.
StatsAmerica is an extensive and up-to-date collection of data and indices related to economic and community development. The site is also a handy source of Census and other federal data at the County, Place, or MSA level.
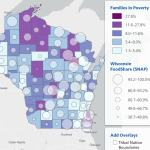
APL’s Wisconsin Food Security Project provides data to help identify food security strengths, risk factors, and gaps via socio-economic factors.
APL’s Wisconsin Risk and Reach Project assesses potential gaps between publicly funded programs and community risks especially as they relate to children and families.
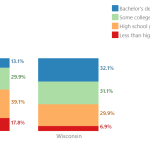
The U.S. Census County Profiles offer a comprehensive and current socio-economic picture of each county in Wisconsin from economic, employment, and housing data to health, education, and demographics.
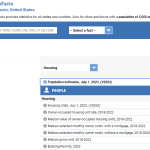
The U.S. Census’ QuickFacts site provides a customizable table of common demographic and socio-economic statistics for the U.S., individual States and Counties, or cities and towns with populations of more than 5,000 people.
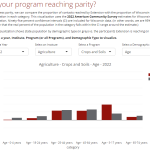
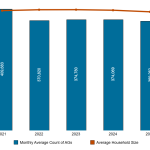
The Parity Visualizer allows users to observe the extent to which UW Extension programing is reaching the population of Wisconsin by comparing the demographics of participants with those of the state.