The UW-Madison Applied Population Lab offers a tremendous breadth of interactive demographic and socio-economic tools, analyses, and reports. Some of these are detailed in this Data Inventory, but APL provides many more than can be listed here.
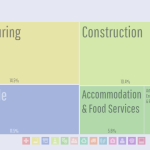
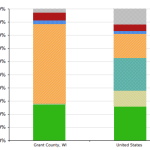
DataUSA is a public-private partnership leveraging U.S. Census and other public data using a flexible dashboard generator for geographies including state, county, and municipality, and Tribal area. Topics include employment, industry, education, income, housing, transportation, poverty, and health.
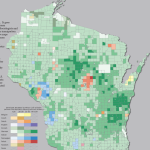
The EPD maps five categories of socioeconomic and demographic Census data at the County, County Subdivision, Tract, and Block Group levels, and includes a number of community assets for additional local context.
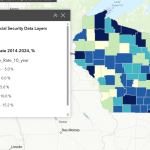
This resource, available only to logged-in wisc.edu users, provides a comprehensive suite of financial well-being indicators for Wisconsin, integrating data on assets, debt, employment, housing, income, and poverty from diverse sources.
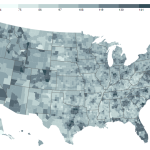
Headwaters Economics is a nonprofit research group focusing on community development and land management. Offered here are a number of tools designed to assess various types of risk at the county or community level.
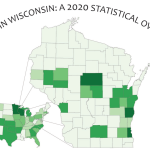
APL’s Hmong Chartbook is the most detailed information source available in regard to the Hmong/HMoob population of Wisconsin.
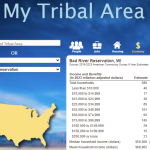
Finding data collected from Tribal Nation geographies can be challenging. This resource allows users to view statistics from the most current ACS aggregated and tabulated specifically to match the boundaries of the designated Tribal Geographies in Wisconsin.
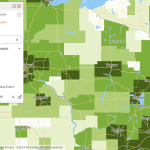
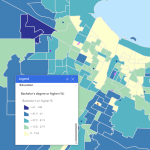
PolicyMap makes one of the most extensive lists of demographic and socio-economic variables accessible in one place—at nearly every level of geography imaginable. Current Census data exists alongside historical data of various types.
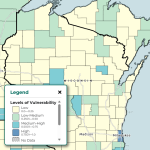
The Social Vulnerability Interactive (SVI) Map, a product of the CDC Agency for Toxic Substances and Disease Registry, displays vulnerability indices for four categories: socioeconomic status, household characteristics, racial and ethnic minority status, and housing type and transportation.
StatsAmerica is an extensive and up-to-date collection of data and indices related to economic and community development. The site is also a handy source of Census and other federal data at the County, Place, or MSA level.
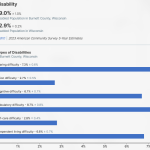
The U.S. Census County Profiles offer a comprehensive and current socio-economic picture of each county in Wisconsin from economic, employment, and housing data to health, education, and demographics.
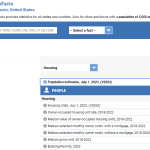
The U.S. Census’ QuickFacts site provides a customizable table of common demographic and socio-economic statistics for the U.S., individual States and Counties, or cities and towns with populations of more than 5,000 people.