The UW-Madison Applied Population Lab offers a tremendous breadth of interactive demographic and socio-economic tools, analyses, and reports. Some of these are detailed in this Data Inventory, but APL provides many more than can be listed here.
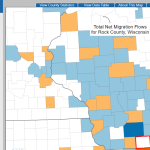
The Census Flow Mapper is an interactive mapping tool that shows the estimated number of people who moved into or out of a given County, and where they moved to or from.
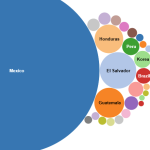
![Screenshot from the Map the Impact [of immigration] tool](https://fyi.extension.wisc.edu/programdevelopment/files/2026/01/MapTheImpact-150x150.png)
This census data visualization tool from the American Immigration Council centers on the economic impact of immigrants as found in ACS data. Topics include immigrant population share, taxes paid, spending power, number of entrepreneurs, and eligible voters.
The Migration Data Hub provides comprehensive profiles and interactive maps detailing the demographics, geographic distribution, and socioeconomic characteristics of immigrant populations mostly at the state level, but some data is available at the county, and local levels.
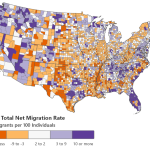
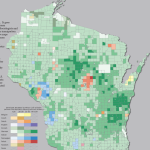
APL’s Net Migration Patterns is an interactive map showing the migration into and out of U.S. Counties disaggregated by age and race/ethnicity.
The Net Migration tool from the UW Applied Population Lab allows users to access a migration profile for each Wisconsin County for the decade starting in 2010.