

Trends in Feed and Manure Phosphorus
by John Peters
Introduction
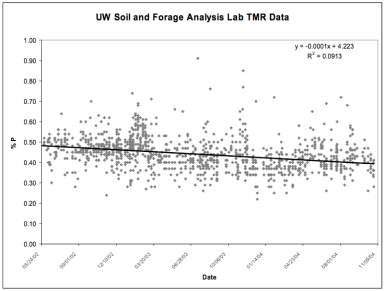
Figure 1.
In the past, the formulation of the mineral levels in dairy total mixed rations (TMR’s) has often been based on book values or NIR estimates of feed and forage quality parameters. To help get a better measure of what was actually being fed to many of Wisconsin’s large dairies, the UW Soil and Forage Analysis Laboratory at Marshfield began offering a TMR Quality Control package in early 2002. This involves collecting a large, representative sample and conducting a wide spectrum of wet chemistry analyses. One of the outcomes of this project was the collection of a large set of wet chemistry mineral data, including phosphorus (P).
What is the current status of phosphorus levels in TMR’s on Wisconsin dairies?

Figure 2.
For the first 100 samples testing during this period, the average total P levels in rations was approximately 0.5%. During the ensuing 30 months or so, there was a steady decline in the average total P content in the TMR samples submitted to the Marshfield laboratory. As of November 2004, the average total P content in samples decreased to approximately 0.4% (Figure 1). This brings the average P level nearly in line with the most recent NRC guidelines for total P in dairy rations. Data from Rock River Laboratory for TMR samples tested during that same period showed a somewhat similar trend.
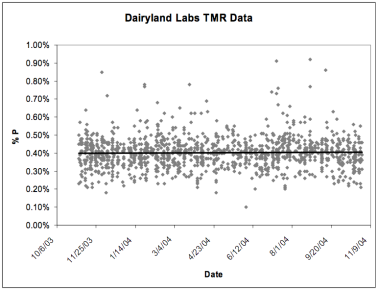
Figure 3.
Typical TMR phosphorus values have declined on the average by about 0.05% during the past three year period (Figure 2). Data from Dairyland Laboratories indicates very little change in TMR phosphorus levels during the past two years. For both years, the average total P content of TMR samples was about 0.40%, although the range or distribution in the individual results is quite large as was seen in the data sets from the other labs (Figure 3).
Are manure P levels being affected by changes in mineral levels in dairy feed rations?
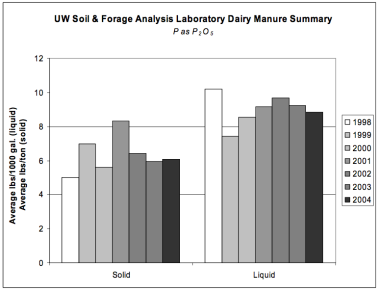
Figure 4.
The UW Soil and Forage Analysis Laboratory at Marshfield is also monitoring trends in total P levels in dairy manure for samples submitted for nutrient analysis. Unfortunately, the manure samples included in this summary are not necessarily taken from the same farms that submitted the TMR feed samples. However, it appears that there may be a trend toward a slight decrease in average P content of solid dairy manure during this 2002-2004 time period. The average total P as P2O5 content of solid dairy manure was 9.69 lbs/ton in 2002 and in 2004 the average was 8.84 lbs/ton (Figure 4). Liquid dairy manure also decreased from an average of 6.42 lbs/1000 gal in 2002 to around 6 lbs/1000gal in both 2003 and 2004.
Is the dietary P issue resolved?
It appears that dairy feed rations in Wisconsin now have total P levels that are on average relatively in line with NRC guidelines. However, there are still many samples that test well above the level of P that has been shown to be adequate. Data from TMR, manure, and also soil samples will continue to be summarized to monitor trends in P levels in dairy farm systems in Wisconsin.
References
National Research Council. 2001. The Nutrient Requirements of Dairy Cattle, 7th Revised Edition. National Academy of Sciences, Washington, D.C.
Focus on Forage – Vol 7: No. 2
© University of Wisconsin Board of Regents, 2005
![]()
John Peters, Director – UW Soil and Forage Testing Labs
University of Wisconsin – Madison
jbpeter1@wisc.edu