
Wisconsin Alfalfa Yield and Persistence (WAYP) Program
2017 Summary Report
PDF Version
Program Objectives:
- To verify the yield and quality of alfalfa harvested from production fields over the life of the stand beginning with the first production year (year after seeding).
- To quantify decreases in stand productivity of alfalfa fields as they age.
2017 Overview:
This summary has now reached eleven years of project data. Once again, UW-Extension agents were asked to identify forage producers who would be willing to weigh and sample forage from a 2016-seeded field and continue to do so for the life of the stand. A total of 8 fields from 5 different farms were enrolled in the program in 2017 and 8 fields continued from previous years. The current summary includes data for the first, second, third, and fourth production years from fields entered into the program in 2014 through 2017 (2013-2016 seedings). There were two fourth-year stands remaining in the project, which are valuable for obtaining long-term data. As is always the case in these types of studies, there is some attrition of fields over time. This is either because the farmer decided to terminate the field because of winterkill, declining productivity or critical yield or forage quality data for a cutting or multiple cuttings could not be obtained. This year there were 18 fields dropped from the project that participated in 2016. Approximately half of these were winterkilled and half were older stands. Production data was collected for 16 fields in 2017 with a total of 3,226 dry matter tons of forage harvested, weighed, and sampled from 824 acres. A summary of all project fields (current and past) is presented in Table 1.
2017 Weather
The growing season overall was characterized by many extremes that ended up averaging out to a “normal” year. After a warm winter, the early season was generally cool and wet in most areas of the state. This led to delayed seeding as soils remained wet. Extreme winterkill was observed in NE Wisconsin counties where all 2nd production year fields and four of six 3rd year fields for this study were lost. This was regardless of a late fall cut being taken or not. First harvest timing was normal because spring growth was not as rapid as some previous years. Temperatures in June were generally near to above normal, while July and August were below normal. September and October were much above normal. Precipitation was variable, but generally wet until July and dry after. Some areas received very little rain in September. A very late killing frost allowed established stands and summer seeding time to recover and strengthen for the winter.
2016 Weather
The growing season overall was above average in terms of temperature and precipitation in most areas of the state. Similar to previous years, this varied across the state and though the season. Many areas had normal temperatures with dry conditions in early spring, leading to quick greenup, rapid growth, and an early first cut. However, by early June, regular and sometimes flooding rains started and persisted through the summer. This made timely harvest and drydown challenging. First cutting again varied widely with some fields being harvested the week before Memorial Day at high quality and others being delayed two weeks or more. Despite the wet weather and flooding, the southern part of the state stayed extremely dry through much of the summer. Late summer and autumn saw above average temperature and rainfall. Many fields were not harvested after mid-late August because of wet field conditions or the producers did not need additional forage. These stands had better than normal fall growth and went into the fall looking good. New seedings had a tough year. Planting was generally timely, but cool and dry conditions in early May slowed growth and allowed disease to thin stands. Wet fields, especially those with previous tillage, had noticeable wheel traffic damage.
2015 Weather
The growing season overall was very close to normal in terms of temperature and precipitation for many areas. Some areas were cooler and drier in early summer, but this balanced out in late summer. September was the warmest on record for many places. Significant winterkill and heaving affected eastern and central areas of the state. The spring was mostly dry and warm, which resulted in timely planting and rapid alfalfa growth in May. First cutting varied widely with many fields being harvested the week before Memorial Day at high quality and others being delayed one to two weeks because of heavy rains that started on Memorial Day weekend. Some of these delayed fields caught up and still had four cuts while other only had three. Many stands had good fall growth and went into the fall looking good.
| Table 1. Field background information | ||||||
| Field # | 1st Production Year |
County | Seeding Mo/Yr. | Seeding Rate (lb/ac) | Field Size (ac) | Last Production Year |
| 107 | 2007 | Outagamie | 05/06 | 15 | 103.7 | 2009 |
| 207 | 2007 | Outagamie | 04/06 | 16 | 79.3 | 2009 |
| 307 | 2007 | Outagamie | 04/06 | 16 | 37.0 | 2010 |
| 407 | 2007 | Outagamie | 04/06 | 16 | 156.7 | 2009 |
| 507 | 2007 | St. Croix | 08/06 | NA | 51.0 | 2009 |
| 607 | 2007 | Waupaca | 04/06 | 15 | 24.1 | 2007 |
| 707 | 2007 | Fond du Lac | 04/06 | 17 | 15.7 | 2007 |
| 807 | 2007 | Fond du Lac | 04/06 | 17 | 39.7 | 2010 |
| 108 | 2008 | Chippewa | 04/07 | 15 | 18.8 | 2009 |
| 208 | 2008 | Marathon | 04/07 | 15 | 5.2 | 2011 |
| 308 | 2008 | Winnebago | 05/07 | 15 | 115 | 2011 |
| 408 | 2008 | Winnebago | 08/07 | 15 | 36.0 | 2011 |
| 508 | 2008 | Winnebago | 05/07 | 15 | 22.0 | 2011 |
| 608 | 2008 | Outagamie | 05/07 | 20 | 83.7 | 2011 |
| 708 | 2008 | Outagamie | 04/07 | 16 | 147.8 | 2011 |
| 808 | 2008 | Outagamie | 04/07 | 16 | 53.0 | 2011 |
| 908 | 2008 | Outagamie | 05/07 | 15 | 50.3 | 2011 |
| 1008 | 2008 | Outagamie | 08/07 | 15 | 194.8 | 2008 |
| 109 | 2009 | St. Croix | 08/08 | NA | 41 | 2011 |
| 209 | 2009 | Winnebago | 04/08 | 15 | 67 | 2012 |
| 309 | 2009 | Winnebago | 08/08 | 15 | 78 | 2011 |
| 409 | 2009 | Brown | 08/08 | 18 | 75 | 2011 |
| 509 | 2009 | Chippewa | 04/08 | 15 | 16.2 | 2009 |
| 609 | 2009 | Calumet | 04/08 | 12 | 15 | 2011 |
| 709 | 2009 | Outagamie | 05/08 | 20 | 74.8 | 2010 |
| 809 | 2009 | Outagamie | 05/08 | 20 | 63 | 2010 |
| 110 | 2010 | Outagamie | 05/09 | 16 | 48 | 2010 |
| 210 | 2010 | Outagamie | 05/09 | 16 | 110.2 | 2012 |
| 310 | 2010 | Outagamie | 05/09 | 16 | 61.7 | 2012 |
| 410 | 2010 | Outagamie | 05/09 | 16 | 111 | 2012 |
| 510 | 2010 | Fond du Lac | 04/09 | 17 | 50.3 | 2012 |
| 610 | 2010 | Fond du Lac | 04/09 | 17 | 19.3 | 2012 |
| 111 | 2011 | Fond du Lac | 04/10 | 17 | 10 | 2013 |
| 211 | 2011 | Brown | 04/10 | 17 | 35.7 | 2012 |
| 311 | 2011 | Outagamie | 05/10 | 20/+4 TF | 75.8 | 2011 |
| 411 | 2011 | Outagamie | 05/10 | 20/+4 TF | 72 | 2011 |
| 112 | 2012 | St. Croix | 08/11 | 16 | 73.9 | 2012 |
| 212 | 2012 | Kewaunee | 05/11 | 17 | 73.5 | 2014 |
| 312 | 2012 | Outagamie | 05/11 | 16 | 143.6 | 2014 |
| 412 | 2012 | Outagamie | 05/11 | 16 | 75 | 2014 |
| 512 | 2012 | Outagamie | 05/11 | 16 | 189 | 2014 |
| Table 1. Field background information (continued) | ||||||
| Field # | 1st Production Year |
County | Seeding Mo/Yr. | Seeding Rate (lb/ac) | Field Size (ac) | Last Production Year |
| 612 | 2012 | Outagamie | 05/11 | 16 | 45.9 | 2014 |
| 712 | 2012 | Outagamie | 05/11 | 16 | 38.7 | 2013 |
| 812 | 2012 | Dodge | 05/11 | 16 | 59.6 | 2013 |
| 113 | 2013 | Columbia | 08/12 | 15 | 44.6 | 2015 |
| 213 | 2013 | Outagamie | 04/12 | 16 | 150.7 | 2014 |
| 313 | 2013 | Outagamie | 04/12 | 16 | 54 | 2014 |
| 413 | 2013 | Outagamie | 04/12 | 16 | 79.3 | 2014 |
| 513 | 2013 | Brown | 08/12 | 28 | 156 | 2013 |
| 114 | 2014 | Fond du Lac | 04/13 | 19 | 32.8 | 2016 |
| 214 | 2014 | Fond du Lac | 07/13 | 17 | 35.7 | 2016 |
| 314 | 2014 | Fond du Lac | 05/13 | 15 | 9.4 | 2016 |
| 414 | 2014 | Fond du Lac | 05/13 | 18 | 20.3 | active |
| 514 | 2014 | Kewaunee | 05/13 | 21 | 32 | 2016 |
| 614 | 2014 | Door | 05/13 | 18 | 60.8 | 2016 |
| 714 | 2014 | Columbia | 04/13 | 14 | 9.4 | active |
| 814 | 2014 | Pierce | 09/13 | 15 | 16.3 | 2015 |
| 914 | 2014 | Marathon | 07/13 | 12 | 14.2 | 2015 |
| 1014 | 2014 | Marathon | 06/13 | 15 | 32.5 | 2016 |
| 1114 | 2014 | Outagamie | 05/13 | 16 | 104.3 | 2014 |
| 1214 | 2014 | Outagamie | 05/13 | 16 | 156.8 | 2014 |
| 1314 | 2014 | Outagamie | 06/13 | 16 | 69 | 2014 |
| 1414 | 2014 | Outagamie | 05/13 | 20/+3.5 TF | 38.9 | 2016 |
| 1514 | 2014 | Outagamie | 06/13 | 20/+3.5 TF | 76.7 | 2015 |
| 115 | 2015 | Manitowoc | 06/14 | 16 | 19.3 | active |
| 215 | 2015 | Door | 07/14 | 18 | 52.0 | 2016 |
| 315 | 2015 | Outagamie | 05/14 | 16 | 55.7 | 2016 |
| 415 | 2015 | Outagamie | 05/14 | 16 | 110.2 | 2016 |
| 515 | 2015 | Outagamie | 05/14 | 16 | 86.5 | active |
| 615 | 2015 | Outagamie | 05/14 | 16 | 45.8 | 2016 |
| 715 | 2015 | Outagamie | 05/14 | 16 | 225.0 | 2016 |
| 815 | 2015 | Marathon | 06/14 | 18 | 11.4 | active |
| 915 | 2015 | Marathon | 06/14 | 15 | 5.61 | 2016 |
| 1015 | 2015 | Columbia | 04/14 | 15 | 15.9 | active |
| 116 | 2016 | Marathon | 04/15 | 12 | 20.0 | active |
| 216 | 2016 | Outagamie | 05/15 | 16 | 215.7 | 2016 |
| 316 | 2016 | Outagamie | 05/15 | 16 | 108.6 | 2016 |
| 416 | 2016 | Outagamie | 05/15 | 16 | 65.0 | 2016 |
| 516 | 2016 | Outagamie | 05/15 | 16 | 78.2 | 2016 |
| 616 | 2016 | Outagamie | 05/15 | 16 | 90.0 | 2016 |
| 716 | 2016 | Columbia | 05/15 | 16 | 11.9 | active |
| 117 | 2017 | Door | 05/16 | 18 | 48.6 | active |
| 217 | 2017 | Kewaunee | 07/16 | 20 | 33.7 | active |
| 317 | 2017 | Outagamie | 05/16 | 16 | 89.6 | active |
| 417 | 2017 | Outagamie | 05/16 | 16 | 103.4 | active |
| 517 | 2017 | Outagamie | 05/16 | 16 | 285.3 | active |
| 617 | 2017 | Columbia | 05/16 | 16 | 16.5 | active |
| 717 | 2017 | Marathon | 05/16 | 12 | 6.2 | active |
| 817 | 2017 | Marathon | 08/16 | 12 | 42.4 | active |
Data Collection:
Project fields were identified and an accurate measure of field size was determined (if not previously known). Forage yield from an entire project field was weighed (usually this was done with an on-farm drive-over scale). Both empty and full weights for all trucks/wagons used were recorded. Beginning in 2008, two forage samples from each harvest were taken and submitted to the Marshfield Soil and Forage Analysis Laboratory (only one sample was submitted per harvest in 2007) for NIR analysis. Data from the two forage samples was averaged and recorded into a spreadsheet by the local coordinator. The data was then shared with the producer following each harvest. At the end of the season, all data was collected and summarized for this report.
Harvest Schedules:
Mean cutting dates by year are presented in Table 2 and cutting dates for all project fields harvested in 2017 are presented in Table 3. The 2017 season was marked by near average harvest dates for all cuts (Table 2). The average date of each cut was within 2 days of the eleven-year average. Average first-cut date has ranged from May 16 in 2012 to June 10 in 2013. Regardless of first-cut date, the average fourth-cut date is generally within a week of September 1, with the exception of a few extreme weather years. The large majority of fields in this study and in 2017 were cut four times. Across years and sites, 25 fields were cut three times, 159 fields were cut four times (generally prior to or soon after September 1), and 22 fields were cut five times (generally four times before September 1 with a final cut in October).
First cut occurred over a 17 day range (May 24 to June 10) which is close to normal (Table 3). Typically, first cut occurred over 19 days because of varying location and weather. This ranged from 13 in 2007 to 45 in 2015. Twelve of the fields were cut the last week on May and four were cut in June. Throughout the season, cutting date was affected by weather and individual producer’s decisions, contributing to wider ranges in subsequent cuttings. Four fields were cut 3 times this year and none were cut 5 times. The ten 4-cut fields that had the first cut taken in May ended up with a narrow 4th cut range of August 25-29. The average days between cutting for 4-cut fields was 1st to 2nd– 31, 2nd to 3rd– 28, and 3rd to 4th– 34. For the 3-cut fields it was 1st to 2nd– 41 and 2nd to 3rd– 35 days.
| Table 2. Mean cutting dates by year | |||||||||
| 1st Cut | 2nd Cut | 3rd Cut | 4th Cut* | 5th Cut | |||||
| Year | Date | Date | Date | Date | Date | ||||
| 2007 | 22-May | 24-June | 25-July | 30-Aug | 21-Oct | ||||
| 2008 | 3-Jun | 3-Jul | 3-Aug | 29-Aug | 29-Oct | ||||
| 2009 | 31-May | 1-Jul | 4-Aug | 5-Sep | |||||
| 2010 | 22-May | 28-Jun | 2-Aug | 29-Aug | 12-Oct | ||||
| 2011 | 31-May | 1-Jul | 31-Jul | 31-Aug | |||||
| 2012 | 16-May | 14-Jun | 14-Jul | 10-Aug | 21-Sep** | ||||
| 2013 | 10-Jun | 11-Jul | 6-Aug | 7-Sep | |||||
| 2014 | 4-Jun | 9-Jul | 7-Aug | 13-Sep | |||||
| 2015 | 3-Jun | 2-Jul | 3-Aug | 27-Aug | 12-Sep | ||||
| 2016 | 29-May | 26-Jun | 26-Jul | 19-Aug | 1-Sep | ||||
| 2017 | 29-May | 2-Jul | 1-Aug | 29-Aug | |||||
| MEAN | 29-May | 30-Jun | 30-Jul | 29-Aug | 1-Oct | ||||
|
*average excludes data where a 4th-cut was taken in October ** average includes 2 fields with 5th-cuts taken in late-August and 2 taken in early September |
|||||||||
| Table 3. Summary of 2017 Cutting Dates | ||||||
| Field ID# | County | 1st Cut Date | 2nd Cut Date |
3rd Cut Date |
4th Cut Date |
5th Cut Date |
| 414 | Fond du Lac | 24-May | 20-Jun | 24-Jul | 22-Aug | |
| 714 | Columbia | 25-May | 25-Jun | 23-Jul | 28-Aug | |
| 115 | Manitowoc | 28-May | 27-Jun | 21-Jul | 21-Aug | |
| 515 | Outagamie | 26-May | 28-Jun | 22-Jul | 23-Aug | |
| 815 | Marathon | 5-Jun | 9-Jul | 19-Aug | 27-Sep | |
| 1015 | Columbia | 26-May | 25-Jun | 23-Jul | 29-Aug | |
| 116 | Marathon | 10-Jun | 31-Jul | 31-Aug | ||
| 716 | Columbia | 25-May | 27-Jun | 24-Jul | 29-Aug | |
| 117 | Door | 29-May | 4-Jul | 30-Jul | ||
| 217 | Kewaunee | 6-Jun | 4-Jul | 8-Aug | 11-Sep | |
| 317 | Outagamie | 27-May | 29-Jun | 22-Jul | 23-Aug | |
| 417 | Outagamie | 28-May | 29-Jun | 23-Jul | 23-Aug | |
| 517 | Outagamie | 28-May | 29-Jun | 23-Jul | 23-Aug | |
| 617 | Outagamie | 26-May | 25-Jun | 23-Jul | 29-Aug | |
| 717 | Marathon | 31-May | 7-Jul | 19-Aug | ||
| 817 | Marathon | 6-Jun | 16-Jul | 22-Aug | ||
| MEAN | 29-May | 2-Jul | 1-Aug | 29-Aug | ||
| EARLIEST | 24-May | 20-Jun | 21-Jul | 21-Aug | ||
| LATEST | 10-Jun | 31-Jul | 31-Aug | 27-Sept | ||
Forage Dry Matter at Harvest:
Alfalfa was harvested as haylage for all but 18 individual cuttings over the eleven years. Harvest dry matter data from the dry hay harvests was not included in the forage dry matter data means. Although project participants are not asked about storage structure, there is good reason to believe most of the farms are storing this forage in bunkers, piles, or bags.
Throughout the duration of this project total season dry matter percentage of harvested forage has ranged from 40 to 50% (Figure 1), though individual cuttings and total-season field means sometimes exceeded 50%, especially later in the season. It’s been questioned if this is too dry for obtaining optimum storage porosity in a bunker or pile. The trend has been toward lower dry matter percentages in recent years. For 2017 the average dry matter across all cuttings was 44%; however this ranged from 32 to 52%. Four fields finished the season with total-season dry matter means under 40% and one field was above 50%. It’s unclear if this was purposeful or if it is simply attributable to environmental conditions. 1st cut tends be harvested at a lower dry matter than other cuts. This is likely because drying weather improves through the season and this was the case in 2017.

Forage Dry Matter Yield:
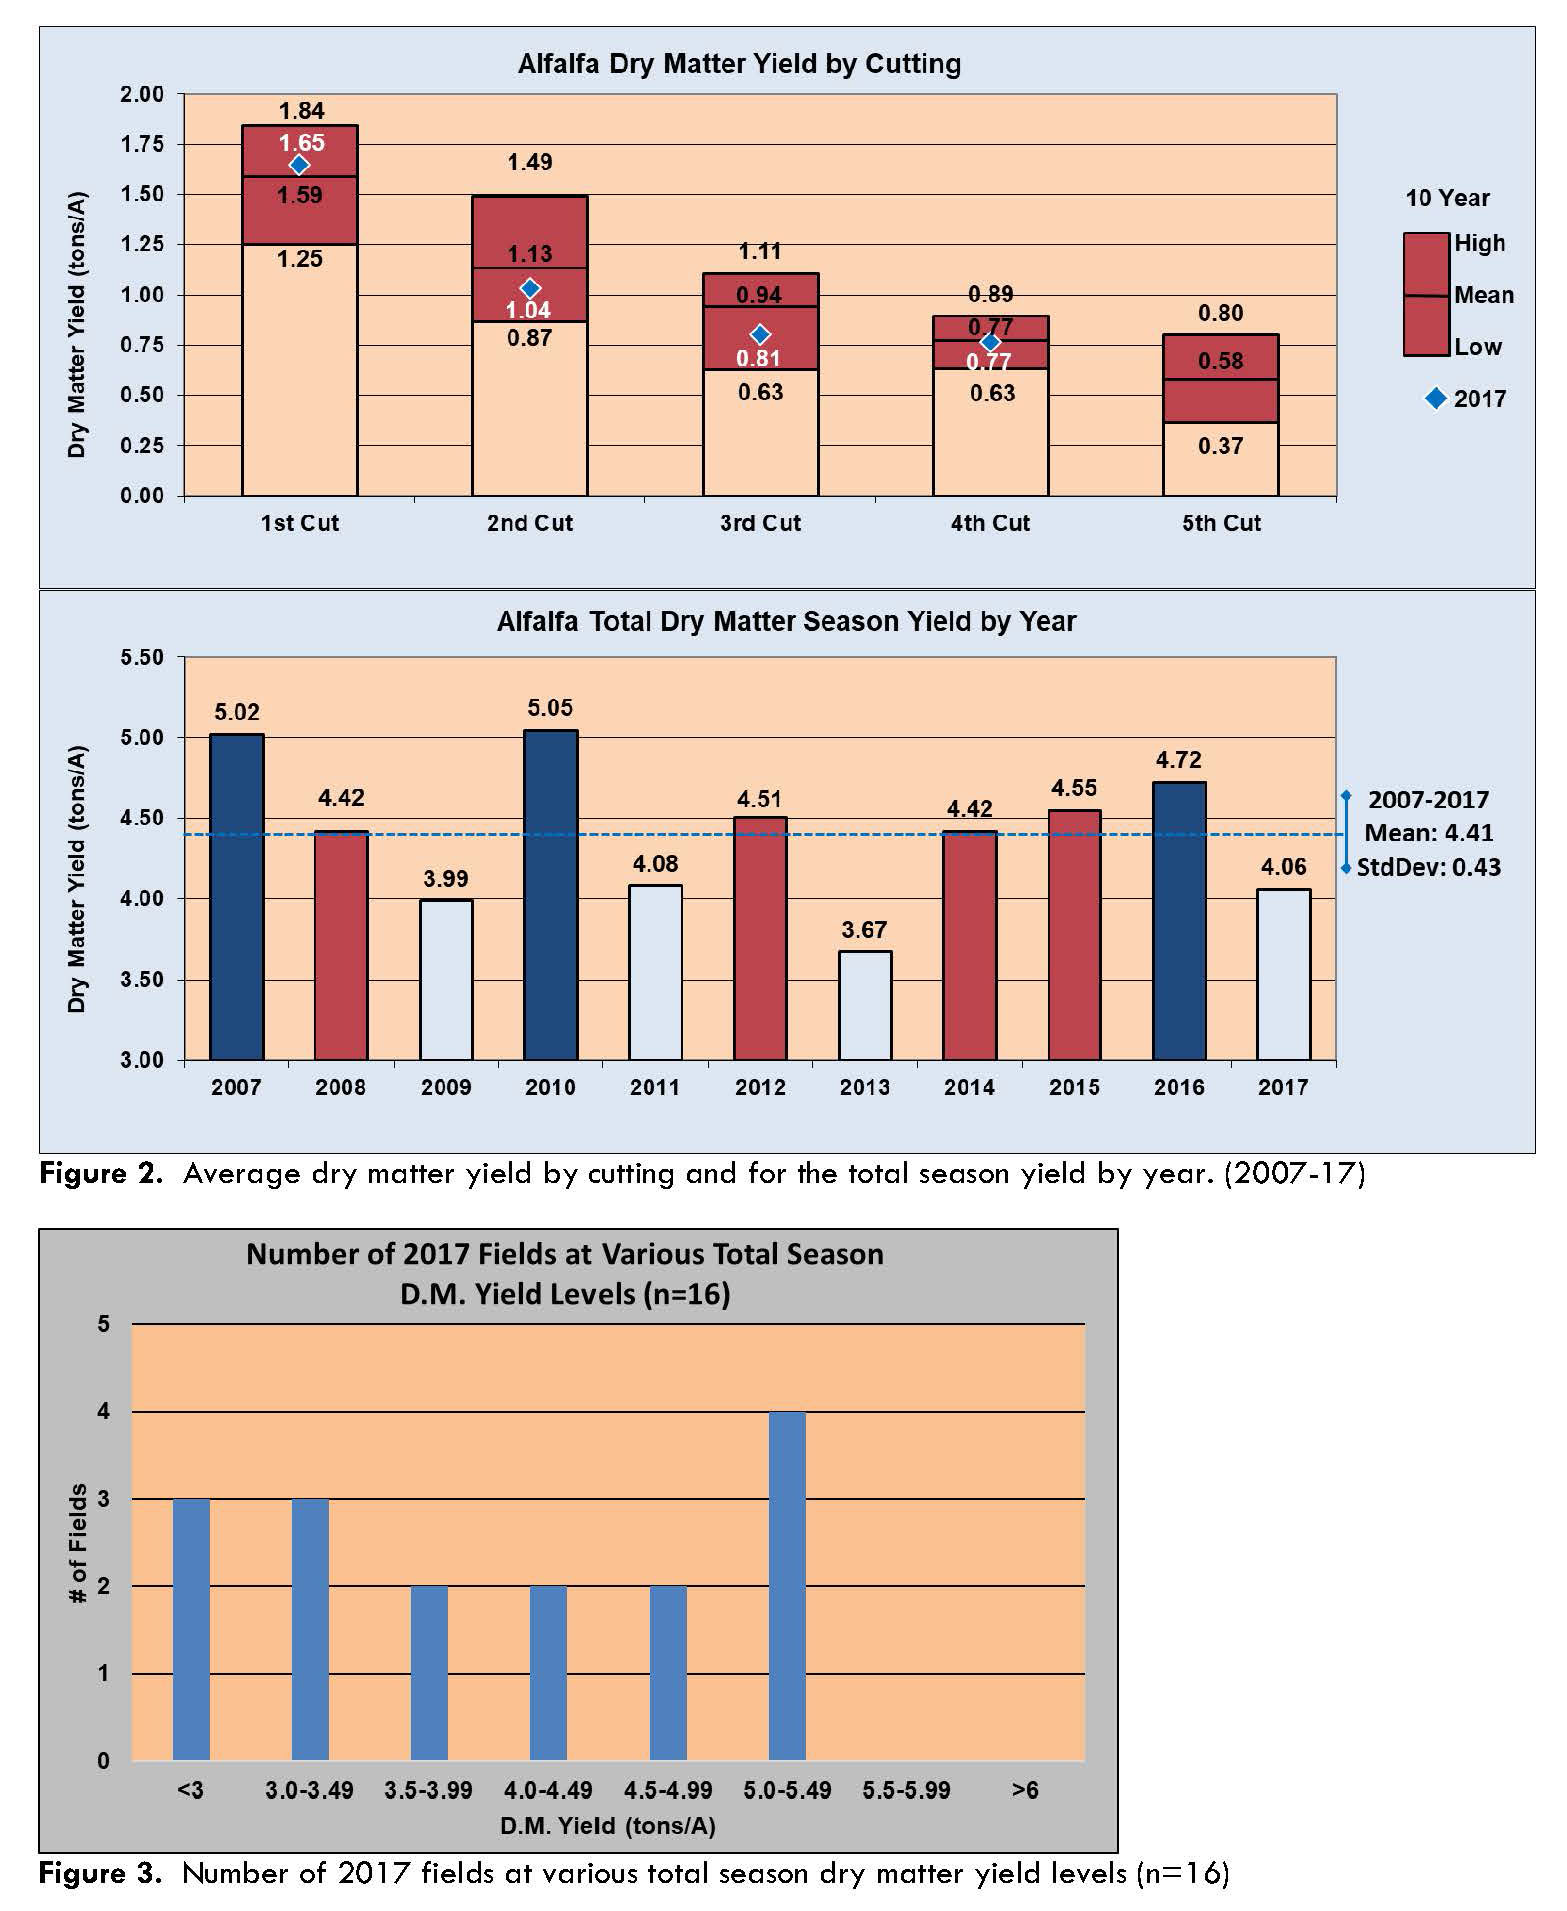
Average yield by cutting and for the season in each project year are presented in Figure 2. The highest average dry matter yields of just over 5.0 tons per acre were obtained in 2007 and 2010. A record low total-season dry matter yield average was set in 2013 at 3.7 tons per acre.
The average yield across all fields was 4.06 tons per acre in 2017, which was the third lowest year and 0.35 below the eleven-year average of 4.41 tons per acre. The overall season yield was nearly identical to 2011 and a little better than the challenging years of 2009 and 2013. First-cut yield of 1.65 tons per acre was slightly above average. This could be because harvest in some fields was delayed by wet field conditions. Second and third-cut yields were below average at 1.04 and 0.81 tons per acre, respectively. Fourth cut yield of 0.77 tons per acre was at the average. No fields were cut five times this year. Detailed yield data for each field by year are presented in Appendix A.
Once again there was extreme variation between fields in 2017 (Figure 3). Yields ranged from a high of 5.35 to a low of 2.60 tons per acre. No fields exceeded 6.0 tons per acre which is the benchmark for top yields in the study having only been reached 10 times over 11 years. The highest yielding field since the project’s inception was 6.55 tons per acre in 2012. In contrast, three fields did not reach 3.0 tons per acre. Some of these fields likely suffered winter injury, but producers had to keep them in production to get some forage. There have now been 12 fields that did not reach 3.0 tons per acre (Appendix A).
Alfalfa Persistence:
In-season: An analysis was done to determine the percent of total season yield for each cutting (Table 4). Data was summarized for 3-, 4-, and 5-cut systems for all project years. Five-cut fields were also included in the 4-cut summary with the final fall harvest not included in the total season yield. It’s significant to note the wide variation in percent yield for an individual cutting. In some cases this is the result of environmental conditions (e.g. drought) previous to the harvest while in other situations it’s simply a function of cutting date (Tables 2 and 3). The 4-cut system in 2017 showed little variation from the long term mean. However, the 3-cut system had a greater proportion of the season yield in the first cut than expected.
| Table 4. Average percent of total season yield by cutting for 3, 4 and 5 cut harvest systems* (2007-17) | |||||
| 3-cut system (4-Fall) (n=29 site years) | |||||
| 1st cut | 2nd cut | 3rd cut | |||
| 2017 | 53 | 24 | 22 | ||
| Mean | 46 | 28 | 26 | ||
| Low | 26 | 15 | 13 | ||
| High | 72 | 43 | 49 | ||
| 4-cut system (3+Fall, 5-Fall) (n=175 site years) | |||||
| 1st cut | 2nd cut | 3rd cut | 4th cut | ||
| 2017 | 37 | 26 | 19 | 18 | |
| Mean | 36 | 25 | 21 | 18 | |
| Low | 20 | 14 | 5 | 5 | |
| High | 58 | 37 | 34 | 30 | |
| 5-cut system (4+Fall) (n=22 site years) | |||||
| 1st cut | 2nd cut | 3rd cut | 4th cut | 5th cut | |
| Mean | 31 | 23 | 18 | 16 | 12 |
| Low | 21 | 14 | 10 | 9 | 6 |
| High | 41 | 39 | 26 | 24 | 18 |
* high and low figures are for individual cuttings and will not add to 100%
Between years: Persistence is influenced over time by the age of the stand, cutting schedule, and environment. For this project, persistence is being measured as a percent of 1st production year dry matter yield. Persistence data in Table 5 consists of 2006 through 2015-seeded fields and is averaged over all cutting schedules. Although ranges indicate a wide variation, average forage yield in the 2nd and 3rd production year have been comparable to the 1st production year. The yield for 4th-year stands drops to 79% of the 1st-production year. To date it appears that keeping stands for at least three production years seems to be the prudent decision, but the condition and productivity of individual fields are the most important factors in determining when to rotate to a different crop. The numbers could also be somewhat misleading because not all fields are kept for a full 4-year production cycle. Those that are removed earlier at the producer’s discretion no longer generate data which would result in lower averages. Therefore this should be viewed as data from fields that producer’s judge good enough to keep.
| Table 5. Percent of 1st production year yield by cutting and total season for 2nd, 3rd, and 4th production year stands. (2007-17) | |||||
| 2nd Production Year Stands (n=64 site years) | |||||
| 1st cut | 2nd cut | 3rd cut | 4th cut | Season | |
| Mean | 113 | 105 | 112 | 100 | 102 |
| Low | 44 | 39 | 23 | 39 | 63 |
| High | 275 | 291 | 491 | 279 | 236 |
| 3rd Production Year Stands (n=44 site years) | |||||
| 1st cut | 2nd cut | 3rd cut | 4th cut | Season | |
| Mean | 106 | 106 | 105 | 96 | 98 |
| Low | 57 | 43 | 32 | 23 | 63 |
| High | 250 | 299 | 370 | 169 | 183 |
| 4th Production Year Stands (n=13 site years) | |||||
| 1st cut | 2nd cut | 3rd cut | 4th cut | Season | |
| Mean | 86 | 84 | 94 | 75 | 79 |
| Low | 38 | 47 | 54 | 23 | 59 |
| High | 138 | 147 | 141 | 132 | 115 |
Forage Quality:
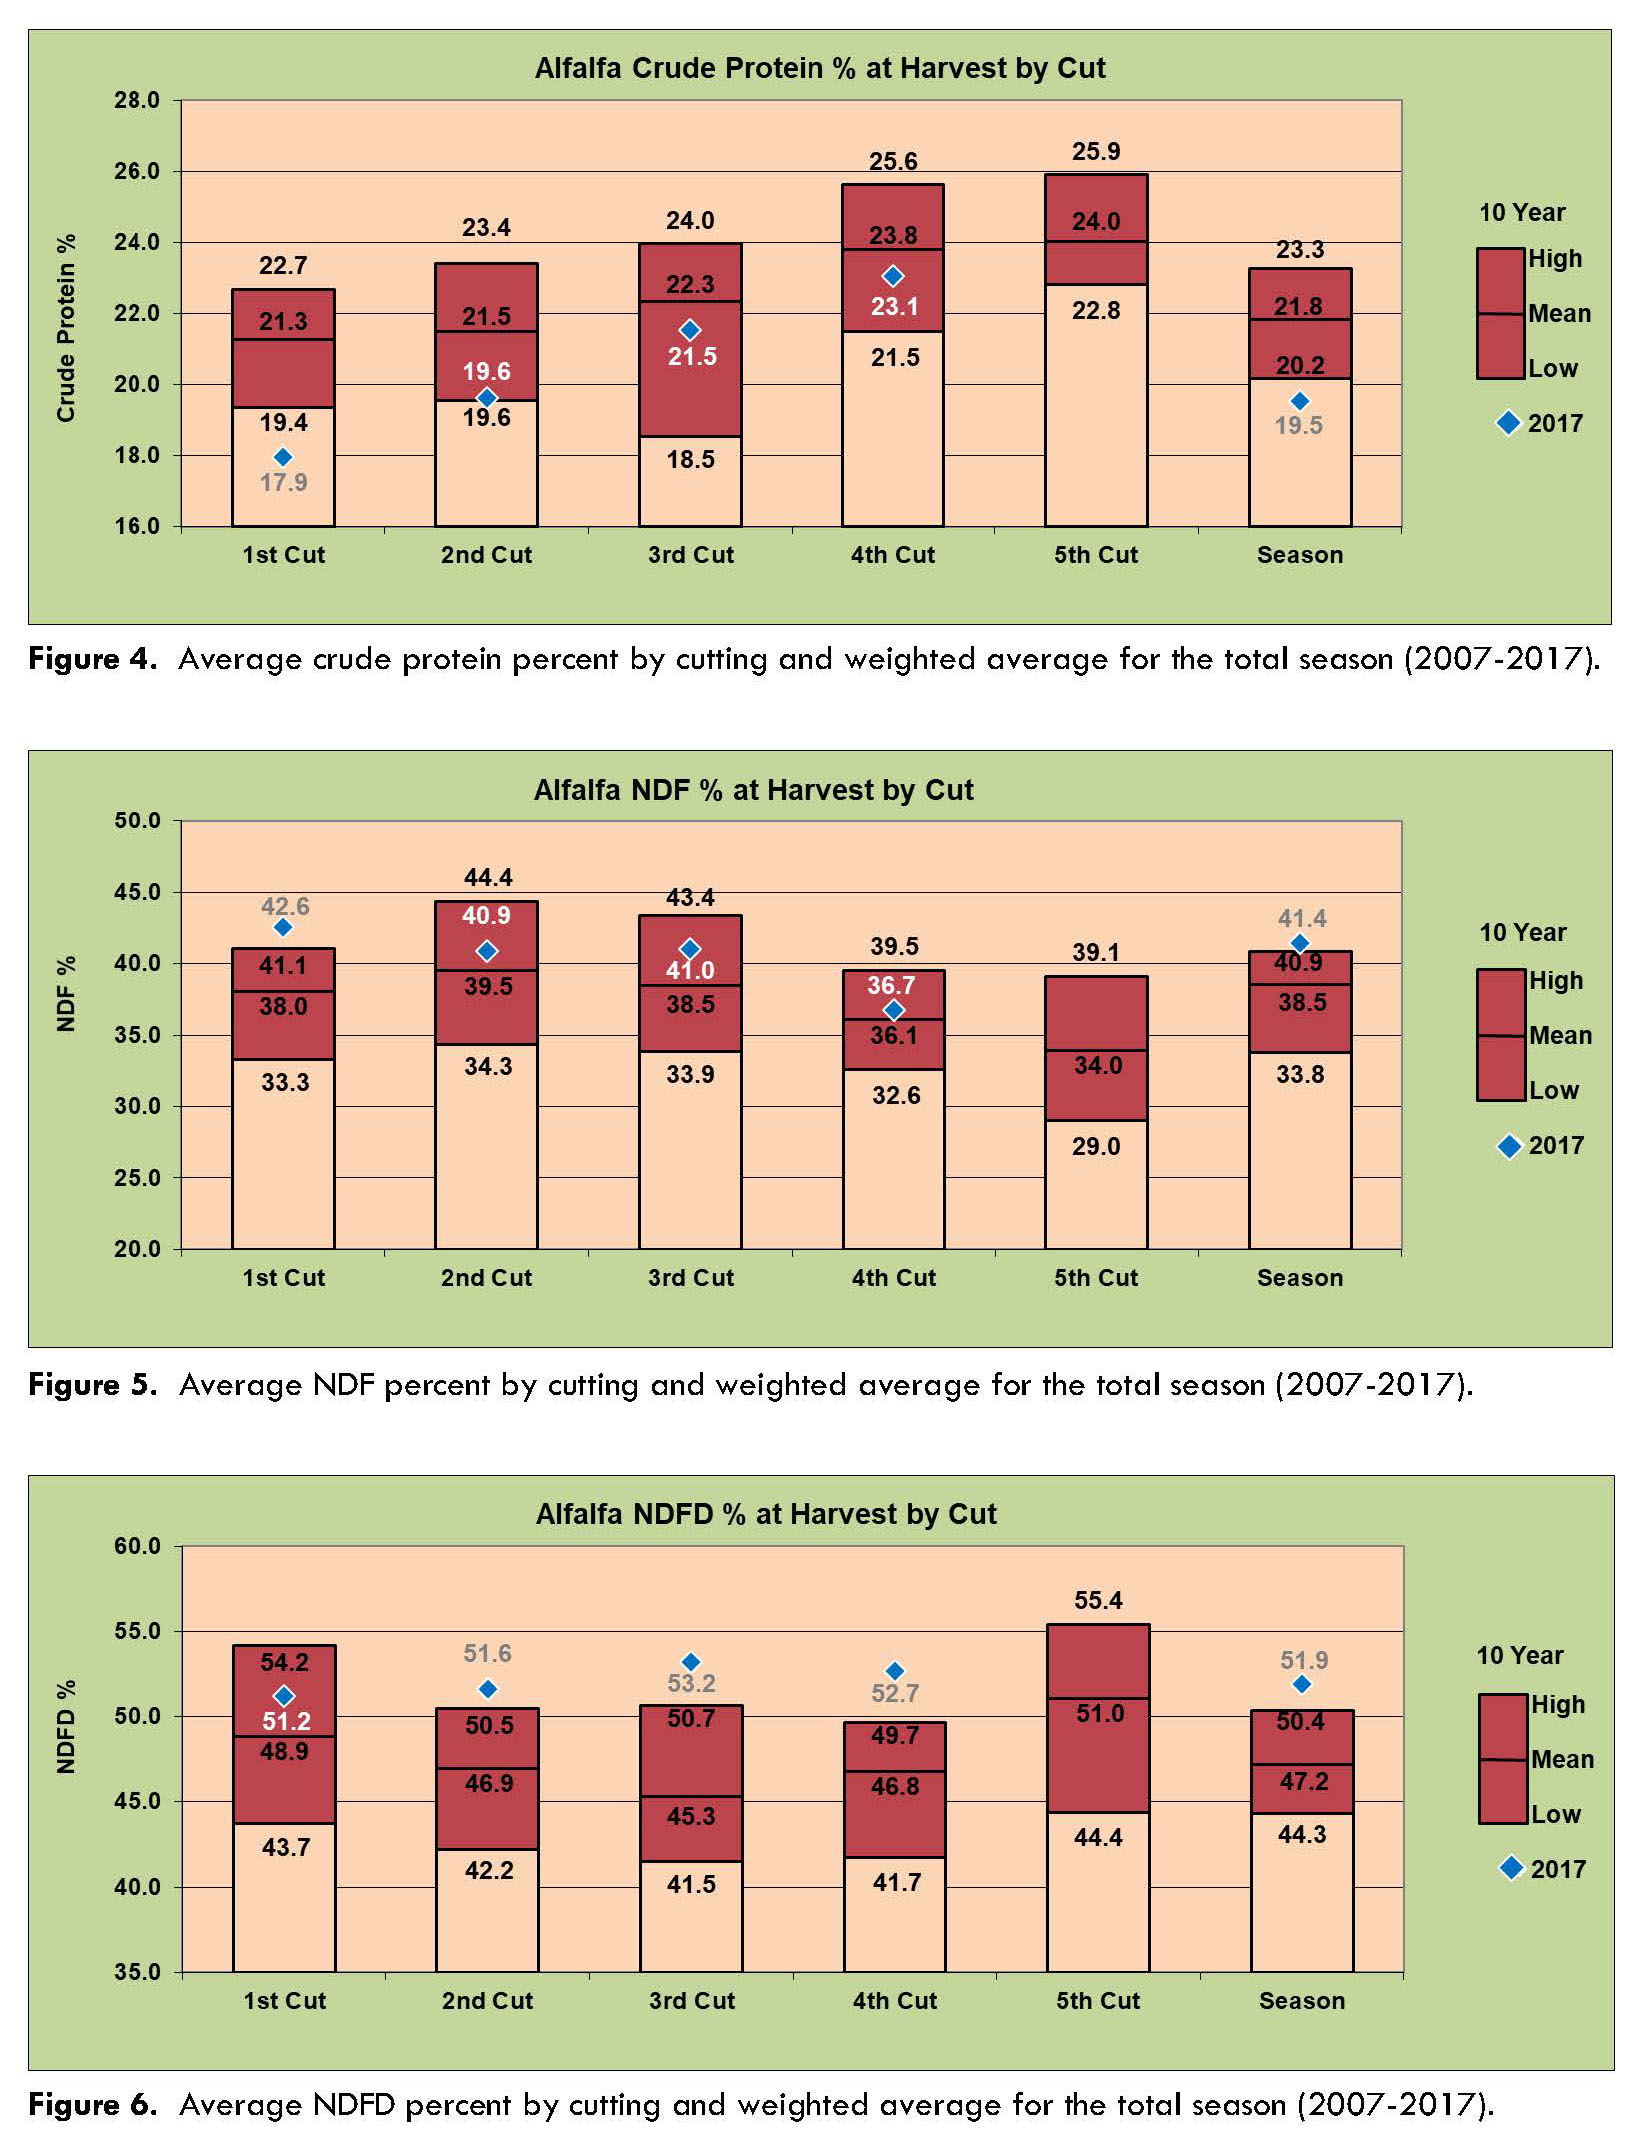
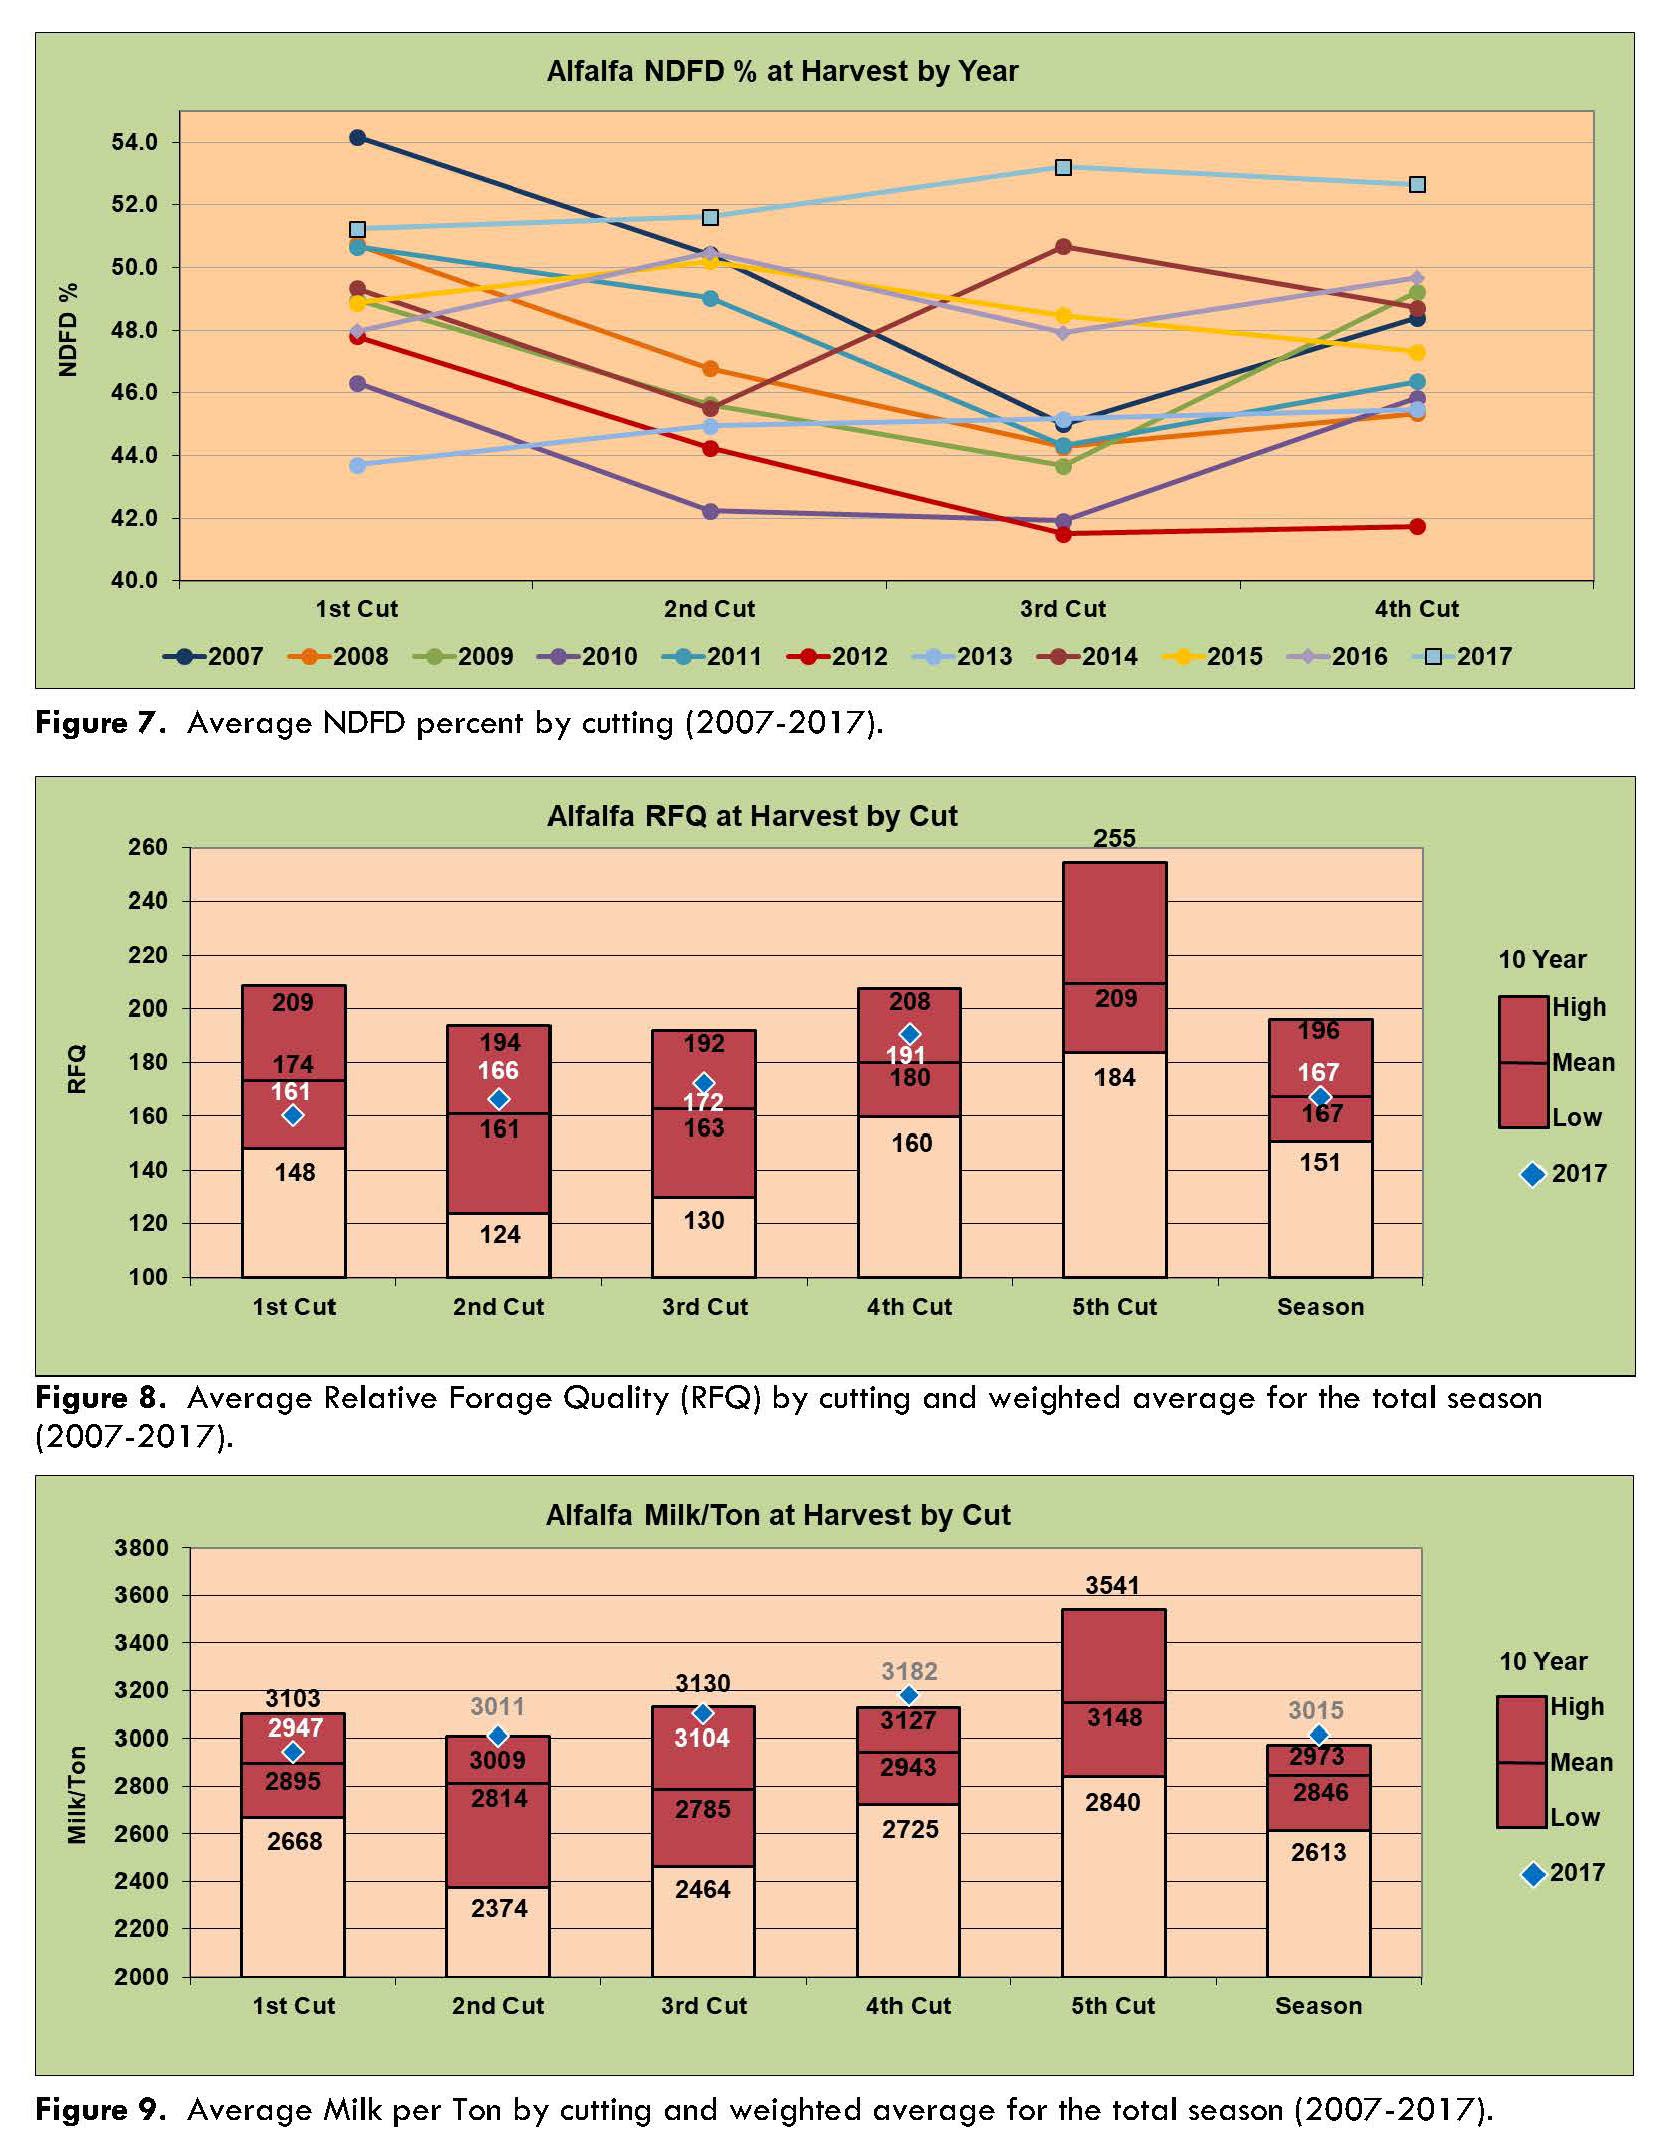
Forage quality, although extremely important, is not the primary focus of this project. However, it is impossible to evaluate changes in management to maximize yield and persistence without considering the impact on forage quality. Harvested forage quality in 2017 showed consistency through the first three cuttings (161-172 RFQ) before increasing in the fourth cut (192 RFQ). (Figure 8). 1st cut was below average, but the later cuts were above. The total season average RFQ was 167, which matches the long-term average. This is should be adequate for dairy quality forage. The reduction in quality on 1st cut was likely caused by weather issues and the amount of overwintering residue on fields from excellent fall growth. This also likely reduced crude protein content in cut 1 (Figure 4). The average of 17.9% was 1.5% below 2016, which also was a record low by 1.2%. Crude protein also matched the record low in cut 2 and was below average in cut 3 and cut 4. The overall level season mean of 19.5% was the lowest seen in the eleven year study.
A bright spot again was NDFD (Figure 7). All cuts were consistently high and the best or second best seen in the study. The overall season NDFD of 51.9% ranked first ahead of 50.4% in 2007. (Figure 6)
Other notable forage quality results from 2017 included:
- Although much below normal, crude protein percent consistently increased through the season (Figure 4), similar to previous years. The overall season percent still set a record low because much of the total production is weighted toward the first two cuts. The previous worst years were seen in 2016 and 2010. This was the fourth year in a row with decreasing crude protein levels.
- NDF percent was above average for each cut and the total season (Figure 5). Cut 1 (42.6%) and total season (41.4%) topped previous record highs that were set in 2016. Other cuts were in the top three or four. This was the fifth year in a row with increasing NDF.
- NDFD percent was the second highest for cut 1 and set new records for cut 2, cut 3, cut 4, and the season total. (Figure 8). This is the third straight year with good NDFD levels.
- Milk/Ton for all cuts was above average and cut 2, cut 4, and total season set new high marks. The 2017 average of 3,015 lbs/tn bests the 2,973 lbs/tn observed in 2007, the first year of the study when all fields were in the first production year.
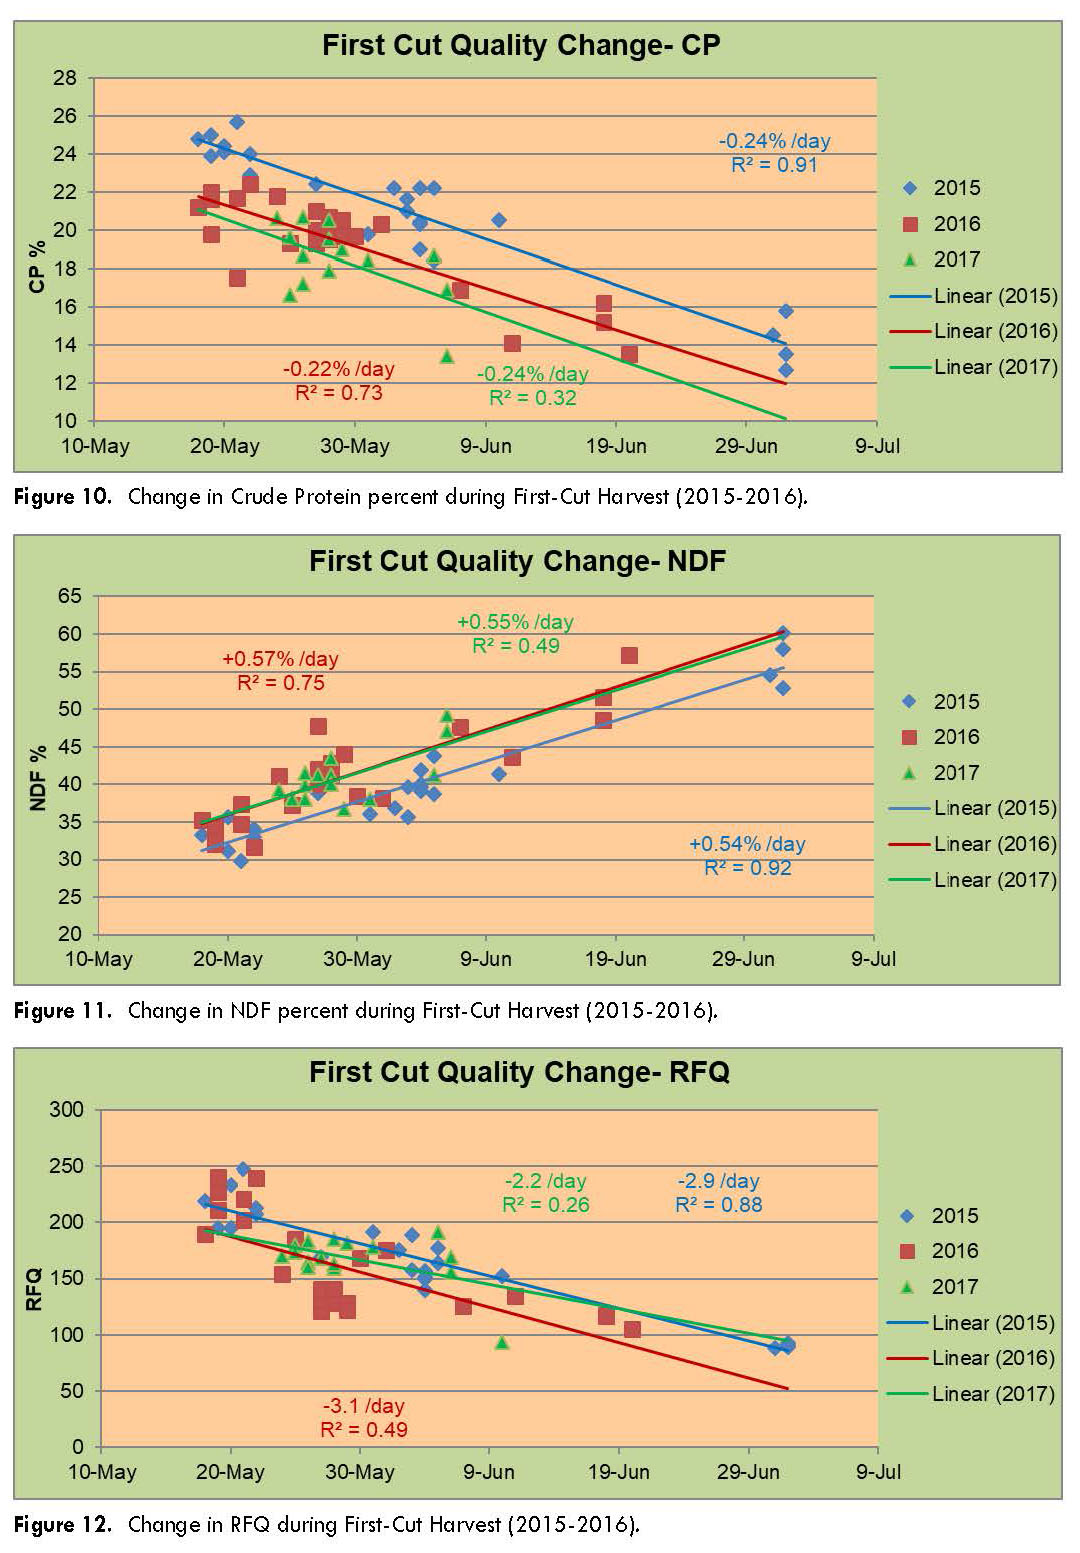
- Crude protein, NDF, and RFQ changes were tracked during 1st crop because harvest was extended each of the past two years. There was a shorter harvest window in 2017, which lowered the confidence, but similar results were observed as previous years. A regression shows that crude protein dropped 0.22 – 0.24% per day, NDF increased 0.54 – 0.57% per day and RFQ decreased 2.2 – 3.1 points per day as harvest progressed in 2015 to 2017 (Figures 10-12). These numbers are similar to the expected change of -0.25%/day for crude protein, slightly more than +0.41%/day expected for NDF and less than -4 to -5/day expected for RFQ.
Summary:
The Wisconsin Alfalfa Yield and Persistence Program is designed to provide forage growers and agricultural professionals a unique look at what is happening at the farm level. As more fields are entered and years pass, the reliability of information continues to increase. One field was planted to a low-lignin variety in 2017. It will be interesting to see if results change as more low-lignin varieties are used by producers. Environmental conditions have had a profound influence on both yield and quality with no two years being exactly alike.
Acknowledgements:
First and foremost, UW-Extension Team Forage wishes to thank the producers who took the extra time and effort to obtain weights and forage samples for the project fields at each cutting.
Past and Present UW coordinators for this project:
|
Mike Bertram, Columbia County Aerica Bjurstrom, Kewaunee County Greg Blonde, Waupaca County Jerry Clark, Chippewa County Scott Gunderson, Manitowoc County Mark Hagedorn, Brown County Kevin Jarek, Outagamie County |
Tina Kohlman, Fond du Lac County David Laatsch, Dodge County Bryce Larson, Calumet County Mike Rankin, Fond du Lac County Nick Schneider, Winnebago County Ryan Sterry, St. Croix County |
Funding for this project has been provided by the Midwest Forage Association (MFA) and UW Extension Team Forage.
This report was written and data compiled by Mike Bertram, Superintendent, UW Arlington Agricultural Research Station and Jason Cavadini, Asst. Superintendent, UW Marshfield Agricultural Research Station. Questions may be directed to: mbertram@wisc.edu or jason.cavadini@wisc.edu Reports from 2007-2014 were written by Mike Rankin, Emeritus Crops and Soils Agent, Fond du Lac Co.
| Appendix A. Dry matter yield by field, harvest year, cutting, and total season. | |||||||
| Field ID# |
Harvest Year |
1st Cut DM Yield |
2nd Cut DM Yield |
3rd Cut DM Yield |
4th Cut DM Yield |
5th Cut DM Yield |
Season DM Yield |
| 107 | 2007 | 1.57 | 1.53 | 0.95 | 0.59 | 0.34 | 4.98 |
| 207 | 2007 | 1.52 | 1.33 | 1.00 | 0.70 | 0.73 | 5.27 |
| 307 | 2007 | 1.54 | 1.51 | 1.30 | 0.90 | 0.88 | 6.12 |
| 407 | 2007 | 1.41 | 1.57 | 1.11 | 0.80 | 0.71 | 5.59 |
| 507 | 2007 | 1.00 | 1.02 | 0.37 | 2.39 | ||
| 607 | 2007 | 1.79 | 1.77 | 1.20 | 1.14 | 5.90 | |
| 707 | 2007 | 1.75 | 1.23 | 0.81 | 0.63 | 4.41 | |
| 807 | 2007 | 1.79 | 1.19 | 1.42 | 1.10 | 5.51 | |
| Mean | 2007 | 1.55 | 1.39 | 1.02 | 0.84 | 0.67 | 5.02 |
| Low | 2007 | 1.00 | 1.02 | 0.37 | 0.59 | 0.34 | 2.39 |
| High | 2007 | 1.79 | 1.77 | 1.42 | 1.14 | 0.88 | 6.12 |
| 107 | 2008 | 1.28 | 1.11 | 1.07 | 0.43 | 3.89 | |
| 207 | 2008 | 1.34 | 1.08 | 1.14 | 0.68 | 4.23 | |
| 307 | 2008 | NA | 0.86 | 0.91 | 0.78 | — | |
| 407 | 2008 | NA | 1.14 | 1.09 | 0.68 | — | |
| 507 | 2008 | 1.95 | 1.08 | 0.76 | 3.79 | ||
| 807 | 2008 | 2.23 | 1.73 | 1.31 | 0.82 | 6.08 | |
| 108 | 2008 | 1.38 | 0.74 | 1.15 | 3.27 | ||
| 208 | 2008 | 2.08 | 1.54 | 0.84 | 4.46 | ||
| 308 | 2008 | 1.46 | 0.83 | 1.27 | 0.93 | 0.45 | 4.95 |
| 408 | 2008 | 0.86 | 0.49 | 0.85 | 0.50 | 2.70 | |
| 508 | 2008 | 2.01 | 0.72 | 1.20 | 0.98 | 0.37 | 5.29 |
| 608 | 2008 | 1.39 | 1.78 | 1.54 | 0.92 | 5.63 | |
| 708 | 2008 | 1.28 | 1.05 | 1.18 | 0.89 | 4.40 | |
| 808 | 2008 | 1.81 | 1.20 | 1.27 | 0.79 | 5.07 | |
| 908 | 2008 | 0.73 | 0.94 | 0.89 | 1.12 | 3.68 | |
| 1008 | 2008 | NA | 1.06 | 0.97 | 0.83 | — | |
| Mean | 2008 | 1.52 | 1.08 | 1.09 | 0.80 | 0.41 | 4.42 |
| Low | 2008 | 0.73 | 0.49 | 0.76 | 0.43 | 0.37 | 2.70 |
| High | 2008 | 2.23 | 1.78 | 1.54 | 1.12 | 0.45 | 6.08 |
| 107 | 2009 | 0.95 | 1.06 | 0.30 | 0.99 | 3.31 | |
| 207 | 2009 | 1.28 | 1.23 | 0.53 | 1.00 | 4.04 | |
| 307 | 2009 | 1.02 | 1.23 | 0.69 | 0.93 | 3.87 | |
| 407 | 2009 | 1.59 | 1.02 | 0.53 | 0.85 | 3.99 | |
| 507 | 2009 | 1.38 | 0.90 | 0.49 | 0.76 | 3.53 | |
| 807 | 2009 | 1.56 | 0.99 | 0.98 | 0.62 | 4.15 | |
| 108 | 2009 | 1.52 | 0.83 | 0.80 | 3.15 | ||
| 208 | 2009 | 1.77 | 1.18 | 1.33 | 4.28 | ||
| 308 | 2009 | 1.24 | 0.94 | 0.56 | 1.15 | 3.89 | |
| 408 | 2009 | 1.80 | 0.80 | 0.20 | 0.64 | 3.43 | |
| 508 | 2009 | 1.74 | 1.00 | 0.59 | 0.98 | 4.32 | |
| 608 | 2009 | 2.19 | 1.23 | 0.88 | 0.78 | 5.07 | |
| 708 | 2009 | 1.40 | 1.34 | 0.63 | 0.98 | 4.35 | |
| 808 | 2009 | 2.07 | 1.16 | 0.59 | 0.55 | 4.37 | |
| 908 | 2009 | 1.88 | 0.99 | 0.30 | 0.95 | 4.13 | |
| 109 | 2009 | 0.57 | 0.55 | 1.09 | 2.21 | ||
| 209 | 2009 | 1.92 | 1.60 | 0.69 | 1.06 | 5.27 | |
| 309 | 2009 | 1.14 | 0.84 | 0.43 | 1.05 | 3.46 | |
| 409 | 2009 | 1.45 | 1.24 | 0.35 | 0.32 | 3.37 | |
| 509 | 2009 | 2.05 | 0.88 | 0.57 | 3.49 | ||
| 609 | 2009 | 2.36 | 0.58 | 0.20 | 0.95 | 4.10 | |
| Field ID# |
Harvest Year |
1st Cut DM Yield |
2nd Cut DM Yield |
3rd Cut DM Yield |
4th Cut DM Yield |
5th Cut DM Yield |
Season DM Yield |
| 709 | 2009 | 2.27 | 1.25 | 0.82 | 0.92 | 5.26 | |
| 809 | 2009 | 2.08 | 1.03 | 0.85 | 0.72 | 4.68 | |
| Mean | 2009 | 1.62 | 1.04 | 0.63 | 0.85 | 3.99 | |
| Low | 2009 | 0.57 | 0.55 | 0.20 | 0.32 | 2.21 | |
| High | 2009 | 2.36 | 1.60 | 1.33 | 1.15 | 5.27 | |
| 307 | 2010 | 1.16 | 1.24 | 1.24 | 0.52 | 4.17 | |
| 807 | 2010 | 1.38 | 1.32 | 1.22 | 0.81 | 4.74 | |
| 208 | 2010 | 1.99 | 1.65 | 1.26 | 0.62 | 5.52 | |
| 308 | 2010 | 1.65 | 1.66 | 0.85 | 0.41 | 4.57 | |
| 408 | 2010 | 1.85 | 1.46 | 0.76 | 0.51 | 4.58 | |
| 508 | 2010 | 1.88 | 1.81 | 0.69 | 0.48 | 4.86 | |
| 608 | 2010 | 2.09 | 1.79 | 1.46 | 0.82 | 6.16 | |
| 708 | 2010 | 1.45 | 1.33 | 1.39 | 0.67 | 4.84 | |
| 808 | 2010 | 1.66 | 1.77 | 1.57 | 0.90 | 5.91 | |
| 908 | 2010 | 1.83 | 0.84 | 1.27 | 0.51 | 4.45 | |
| 109 | 2010 | 1.57 | 1.42 | 0.90 | 1.33 | 5.23 | |
| 209 | 2010 | 1.91 | 1.80 | 1.09 | 0.91 | 5.71 | |
| 309 | 2010 | 2.16 | 1.85 | 0.91 | 0.70 | 5.61 | |
| 409 | 2010 | 1.43 | 0.96 | 0.55 | 0.39 | 3.33 | |
| 609 | 2010 | 2.34 | 1.78 | 1.05 | 1.00 | 6.17 | |
| 709 | 2010 | 2.32 | 0.94 | 1.08 | 0.57 | 4.90 | |
| 809 | 2010 | 1.86 | 1.67 | 1.07 | 0.47 | 5.07 | |
| 110 | 2010 | 1.46 | 1.65 | 1.40 | 0.54 | 5.05 | |
| 210 | 2010 | 2.07 | 1.76 | 0.94 | 0.51 | 5.28 | |
| 310 | 2010 | 1.59 | 1.21 | 0.97 | 0.57 | 4.33 | |
| 410 | 2010 | 2.00 | 1.26 | 0.94 | 0.41 | 4.61 | |
| 510 | 2010 | 1.87 | 1.69 | 1.05 | 0.62 | 0.39 | 5.62 |
| 610 | 2010 | 2.08 | 1.40 | 1.09 | 0.46 | 0.34 | 5.37 |
| Mean | 2010 | 1.81 | 1.49 | 1.08 | 0.64 | 0.37 | 5.05 |
| Low | 2010 | 1.16 | 0.84 | 0.55 | 0.39 | 0.34 | 3.33 |
| High | 2010 | 2.34 | 1.85 | 1.57 | 1.33 | 0.39 | 6.17 |
| 208 | 2011 | 0.78 | 0.90 | 1.05 | 0.45 | 3.18 | |
| 308 | 2011 | 1.31 | 1.12 | 0.85 | 0.79 | 4.06 | |
| 408 | 2011 | 1.19 | 0.72 | 0.67 | 0.51 | 3.09 | |
| 508 | 2011 | 1.25 | 0.85 | 0.65 | 0.69 | 3.44 | |
| 608 | 2011 | 1.10 | 0.83 | 1.16 | 0.45 | 3.54 | |
| 708 | 2011 | 1.50 | 0.75 | 1.37 | 0.78 | 4.41 | |
| 808 | 2011 | 1.07 | 0.65 | 1.15 | 0.90 | 3.77 | |
| 908 | 2011 | 0.92 | 0.52 | 0.87 | 0.49 | 2.80 | |
| 109 | 2011 | 1.29 | 0.97 | 1.03 | 0.76 | 4.05 | |
| 209 | 2011 | 1.59 | 1.02 | 0.92 | 0.92 | 4.45 | |
| 309 | 2011 | 1.53 | 1.15 | 1.14 | 0.95 | 4.77 | |
| 409 | 2011 | 1.27 | 0.81 | 0.47 | 0.48 | 3.03 | |
| 609 | 2011 | 1.76 | 0.90 | 1.68 | 0.78 | 5.12 | |
| 210 | 2011 | 1.13 | 0.72 | 1.04 | 0.80 | 3.69 | |
| 310 | 2011 | 1.25 | 0.63 | 0.97 | 0.78 | 3.63 | |
| 410 | 2011 | 1.33 | 0.60 | 1.08 | 0.57 | 3.58 | |
| 510 | 2011 | 1.47 | 1.08 | 1.07 | 0.73 | 4.35 | |
| 610 | 2011 | 1.41 | 0.92 | 0.88 | 0.83 | 4.04 | |
| 111 | 2011 | 2.45 | 1.29 | 1.32 | 1.19 | 6.26 | |
| 211 | 2011 | 1.39 | 0.85 | 1.20 | 1.10 | 4.55 | |
| 311 | 2011 | 2.30 | 0.94 | 1.66 | 1.00 | 5.90 | |
| 411 | 2011 | 1.70 | NA | 1.68 | 0.64 | NA | |
| Field ID# |
Harvest Year |
1st Cut DM Yield |
2nd Cut DM Yield |
3rd Cut DM Yield |
4th Cut DM Yield |
5th Cut DM Yield |
Season DM Yield |
| Mean | 2011 | 1.41 | 0.87 | 1.09 | 0.75 | 4.08 | |
| Low | 2011 | 0.78 | 0.52 | 0.47 | 0.45 | 2.80 | |
| High | 2011 | 2.45 | 1.29 | 1.68 | 1.19 | 6.26 | |
| 209 | 2012 | 1.47 | 1.01 | 0.97 | 0.40 | 3.85 | |
| 210 | 2012 | 1.46 | 0.75 | 0.43 | 0.80 | 0.76 | 4.20 |
| 310 | 2012 | 1.22 | 0.67 | 0.45 | 0.69 | 0.45 | 3.48 |
| 410 | 2012 | 1.14 | 0.62 | 0.38 | 0.66 | 0.56 | 3.36 |
| 510 | 2012 | 1.20 | 1.13 | 0.74 | 0.63 | 0.73 | 4.44 |
| 610 | 2012 | 2.33 | 1.18 | 1.12 | 0.66 | 5.30 | |
| 111 | 2012 | 2.03 | 1.79 | 1.55 | 1.18 | 6.55 | |
| 211 | 2012 | 1.11 | 1.10 | 0.78 | 0.79 | 0.48 | 4.26 |
| 112 | 2012 | 1.46 | 0.85 | 1.11 | 0.85 | 0.63 | 4.90 |
| 212 | 2012 | 1.74 | 1.21 | 1.32 | 1.27 | 5.55 | |
| 312 | 2012 | 1.65 | 0.78 | 0.59 | 0.70 | 0.68 | 4.40 |
| 412 | 2012 | 2.06 | 0.81 | 0.64 | 0.86 | 0.64 | 5.00 |
| Mean | 2012 | 1.46 | 1.01 | 0.82 | 0.78 | 0.58 | 4.51 |
| Low | 2012 | 0.84 | 0.62 | 0.38 | 0.40 | 0.34 | 3.36 |
| High | 2012 | 2.33 | 1.88 | 1.55 | 1.27 | 0.76 | 6.55 |
| 111 | 2013 | 1.70 | 0.85 | 0.87 | 0.94 | 4.35 | |
| 212 | 2013 | 1.89 | 1.47 | 1.06 | 0.99 | 5.40 | |
| 312 | 2013 | 1.20 | 1.02 | 0.65 | 0.48 | 3.35 | |
| 412 | 2013 | 1.26 | 1.16 | 0.74 | 0.63 | 3.79 | |
| 512 | 2013 | 1.30 | 1.11 | 0.80 | 0.65 | 3.87 | |
| 612 | 2013 | 0.86 | 0.86 | 0.63 | 0.43 | 2.78 | |
| 712 | 2013 | 0.83 | 1.03 | 0.65 | 0.44 | 2.95 | |
| 812 | 2013 | 1.94 | 1.26 | 1.03 | 0.84 | 5.07 | |
| 113 | 2013 | 2.27 | 1.80 | 1.19 | 5.26 | ||
| 213 | 2013 | 0.82 | 1.08 | 0.62 | 0.76 | 3.28 | |
| 313 | 2013 | 0.82 | 0.83 | 0.51 | 0.60 | 2.76 | |
| 413 | 2013 | 0.92 | 1.11 | 0.72 | 0.50 | 3.25 | |
| 513 | 2013 | 0.47 | 0.40 | 0.44 | 0.30 | 1.62 | |
| Mean | 2013 | 1.25 | 1.08 | 0.76 | 0.63 | 3.67 | |
| Low | 2013 | 0.47 | 0.40 | 0.44 | 0.30 | 1.62 | |
| High | 2013 | 2.27 | 1.80 | 1.19 | 0.99 | 5.40 | |
| 212 | 2014 | 1.76 | 1.53 | 0.77 | 0.88 | 4.93 | |
| 312 | 2014 | 1.69 | 0.97 | 0.70 | 0.80 | 4.16 | |
| 412 | 2014 | 1.56 | 0.89 | 0.75 | 0.70 | 3.90 | |
| 512 | 2014 | 1.48 | 0.59 | 0.76 | 0.65 | 3.48 | |
| 612 | 2014 | 1.41 | 0.66 | 0.54 | 0.59 | 3.20 | |
| 113 | 2014 | 1.80 | 1.70 | 1.24 | 1.03 | 5.79 | |
| 213 | 2014 | 1.39 | 0.51 | 0.64 | 1.05 | 3.58 | |
| 313 | 2014 | 1.09 | 0.53 | 0.66 | 0.84 | 3.13 | |
| 413 | 2014 | 1.87 | 0.68 | 0.67 | 0.90 | 4.12 | |
| 114 | 2014 | 1.93 | 1.88 | 1.24 | 1.25 | 6.28 | |
| 214 | 2014 | 1.49 | 1.77 | 1.36 | 0.88 | 5.50 | |
| 314 | 2014 | 1.88 | 1.14 | 1.02 | 0.73 | 4.77 | |
| 414 | 2014 | 1.74 | 1.99 | 1.19 | 1.09 | 6.02 | |
| 514 | 2014 | 1.77 | 0.89 | 0.55 | 0.75 | 3.95 | |
| 614 | 2014 | 2.13 | 0.88 | 0.35 | 0.73 | 4.09 | |
| 714 | 2014 | 2.96 | 1.24 | 1.02 | 0.91 | 6.12 | |
| 814 | 2014 | 1.42 | 1.22 | 0.42 | 0.70 | 3.75 | |
| 914 | 2014 | 1.18 | 1.20 | 0.93 | 3.31 | ||
| 1014 | 2014 | 2.04 | 1.58 | 1.20 | 4.82 | ||
| 1114 | 2014 | 1.42 | 0.73 | 0.76 | 0.74 | 3.65 | |
| Field ID# |
Harvest Year |
1st Cut DM Yield |
2nd Cut DM Yield |
3rd Cut DM Yield |
4th Cut DM Yield |
5th Cut DM Yield |
Season DM Yield |
| 1214 | 2014 | 1.23 | 0.54 | 0.95 | 0.70 | 3.42 | |
| 1314 | 2014 | 1.20 | 0.49 | 0.88 | 0.83 | 3.39 | |
| 1414 | 2014 | 1.28 | 1.93 | 0.72 | 1.31 | 5.23 | |
| 1514 | 2014 | 1.87 | 1.24 | 0.81 | 1.58 | 5.50 | |
| Mean | 2014 | 1.65 | 1.12 | 0.84 | 0.89 | 4.42 | |
| Low | 2014 | 1.09 | 0.49 | 0.35 | 0.59 | 3.13 | |
| High | 2014 | 2.96 | 1.99 | 1.36 | 1.58 | 6.28 | |
| 113 | 2015 | 1.59 | 1.50 | 1.61 | 0.85 | 5.55 | |
| 114 | 2015 | 1.87 | 1.60 | 1.46 | 1.02 | 5.95 | |
| 214 | 2015 | 1.25 | 0.88 | 0.88 | 0.72 | 0.66 | 4.40 |
| 314 | 2015 | 1.76 | 1.15 | 0.95 | 0.75 | 4.61 | |
| 414 | 2015 | 1.67 | 1.60 | 1.24 | 0.64 | 5.14 | |
| 514 | 2015 | 1.25 | 1.84 | 1.17 | 4.26 | ||
| 614 | 2015 | 2.89 | 1.21 | 0.86 | 0.70 | 5.67 | |
| 714 | 2015 | 1.29 | 0.99 | 1.63 | 0.89 | 4.80 | |
| 814 | 2015 | 1.30 | 0.77 | 0.95 | 0.35 | 3.37 | |
| 914 | 2015 | 2.26 | 0.73 | 1.00 | 3.99 | ||
| 1014 | 2015 | 2.39 | 0.62 | 1.11 | 4.12 | ||
| 1414 | 2015 | 2.04 | 1.26 | 0.95 | 0.82 | 5.06 | |
| 1514 | 2015 | 2.03 | 1.14 | 1.03 | 0.84 | 5.03 | |
| 115 | 2015 | 1.16 | 1.30 | 0.87 | 0.77 | 4.10 | |
| 215 | 2015 | 1.65 | 1.10 | 0.70 | 3.45 | ||
| 315 | 2015 | 1.53 | 0.76 | 1.19 | 1.07 | 4.55 | |
| 415 | 2015 | 1.90 | 0.81 | 0.98 | 0.76 | 4.45 | |
| 515 | 2015 | 1.98 | 0.91 | 1.02 | 0.76 | 4.66 | |
| 615 | 2015 | 1.20 | 0.69 | 0.57 | 0.29 | 2.74 | |
| 715 | 2015 | 1.51 | 0.83 | 0.95 | 0.63 | 3.92 | |
| 815 | 2015 | 1.83 | 1.17 | 0.91 | 3.90 | ||
| 915 | 2015 | 2.33 | 1.05 | 1.91 | 5.28 | ||
| 1015 | 2015 | 1.81 | 1.36 | 1.49 | 0.95 | 5.60 | |
| Mean | 2015 | 1.76 | 1.10 | 1.10 | 0.75 | 0.66 | 4.55 |
| Low | 2015 | 1.16 | 0.62 | 0.57 | 0.29 | 0.66 | 2.74 |
| High | 2015 | 2.89 | 1.84 | 1.91 | 1.07 | 0.66 | 5.95 |
| 114 | 2016 | 2.20 | 1.49 | 1.23 | 0.90 | 5.82 | |
| 214 | 2016 | 1.74 | 1.12 | 0.76 | 0.45 | 4.06 | |
| 314 | 2016 | 2.30 | 1.13 | 0.68 | 0.62 | 4.73 | |
| 414 | 2016 | 1.97 | 1.47 | 1.12 | 0.80 | 5.35 | |
| 514 | 2016 | 1.98 | 1.68 | 1.56 | 5.22 | ||
| 614 | 2016 | 2.22 | 1.12 | 1.28 | 1.07 | 5.70 | |
| 714 | 2016 | 2.17 | 1.35 | 1.08 | 1.06 | 5.66 | |
| 1014 | 2016 | 2.64 | 1.36 | 1.04 | 0.25 | 5.30 | |
| 1414 | 2016 | 1.35 | 1.53 | 1.09 | 0.79 | 4.76 | |
| 115 | 2016 | 1.57 | 1.40 | 1.00 | 0.67 | 0.80 | 5.44 |
| 215 | 2016 | 1.85 | 1.36 | 0.88 | 0.44 | 4.54 | |
| 315 | 2016 | 1.61 | 0.88 | 0.79 | 0.42 | 3.70 | |
| 415 | 2016 | 1.49 | 1.35 | 0.74 | 1.07 | 4.65 | |
| 515 | 2016 | 2.37 | 0.88 | 0.83 | 1.03 | 5.10 | |
| 615 | 2016 | 1.31 | 0.81 | 0.76 | 0.80 | 3.67 | |
| 715 | 2016 | 1.28 | 1.09 | 1.10 | 0.84 | 4.31 | |
| 815 | 2016 | 1.94 | 0.84 | 0.93 | 3.70 | ||
| 915 | 2016 | 2.54 | 1.17 | 1.21 | 4.93 | ||
| 1015 | 2016 | 1.92 | 1.40 | 1.31 | 1.07 | 5.70 | |
| 116 | 2016 | 2.35 | 1.14 | 1.73 | 5.21 | ||
| 216 | 2016 | 1.24 | 0.94 | 0.86 | 0.89 | 3.94 | |
| 316 | 2016 | 1.45 | 0.85 | 0.79 | 0.84 | 3.94 | |
| Field ID# |
Harvest Year |
1st Cut DM Yield |
2nd Cut DM Yield |
3rd Cut DM Yield |
4th Cut DM Yield |
5th Cut DM Yield |
Season DM Yield |
| 416 | 2016 | 1.30 | 0.85 | 0.71 | 0.57 | 3.43 | |
| 516 | 2016 | 1.65 | 0.82 | 0.88 | 0.86 | 4.21 | |
| 616 | 2016 | 1.36 | 0.71 | 0.67 | 0.89 | 3.64 | |
| 716 | 2016 | 2.15 | 1.30 | 1.26 | 1.36 | 6.07 | |
| Mean | 2016 | 1.84 | 1.16 | 1.01 | 0.80 | 0.80 | 4.72 |
| Low | 2016 | 1.24 | 0.71 | 0.67 | 0.25 | 0.80 | 3.43 |
| High | 2016 | 2.64 | 1.68 | 1.73 | 1.36 | 0.80 | 6.07 |
| 414 | 2017 | 1.97 | 1.47 | 1.12 | 0.80 | 5.35 | |
| 714 | 2017 | 2.03 | 0.96 | 1.06 | 1.20 | 5.25 | |
| 115 | 2017 | 1.12 | 1.14 | 1.04 | 0.94 | 4.23 | |
| 515 | 2017 | 1.17 | 1.01 | 0.48 | 0.39 | 3.05 | |
| 815 | 2017 | 1.97 | 0.61 | 0.75 | 0.57 | 3.89 | |
| 1015 | 2017 | 2.04 | 0.98 | 0.58 | 0.79 | 4.39 | |
| 116 | 2017 | 2.37 | 0.51 | 0.42 | 3.30 | ||
| 716 | 2017 | 2.00 | 1.33 | 1.10 | 0.90 | 5.32 | |
| 117 | 2017 | 1.80 | 0.79 | 0.78 | 3.37 | ||
| 217 | 2017 | 1.64 | 1.50 | 1.10 | 0.89 | 5.13 | |
| 317 | 2017 | 0.93 | 0.80 | 0.53 | 0.52 | 2.78 | |
| 417 | 2017 | 0.97 | 0.83 | 0.39 | 0.42 | 2.60 | |
| 517 | 2017 | 1.56 | 1.49 | 0.78 | 0.87 | 4.69 | |
| 617 | 2017 | 1.75 | 1.15 | 0.97 | 0.92 | 4.79 | |
| 717 | 2017 | 1.09 | 0.87 | 0.90 | 2.85 | ||
| 817 | 2017 | 1.99 | 1.12 | 0.88 | 3.99 | ||
| Mean | 2017 | 1.65 | 1.04 | 0.81 | 0.77 | 4.06 | |
| Low | 2017 | 0.93 | 0.51 | 0.39 | 0.39 | 2.60 | |
| High | 2017 | 2.37 | 1.50 | 1.12 | 1.20 | 5.35 | |