Multi-Resolution Land Characteristics
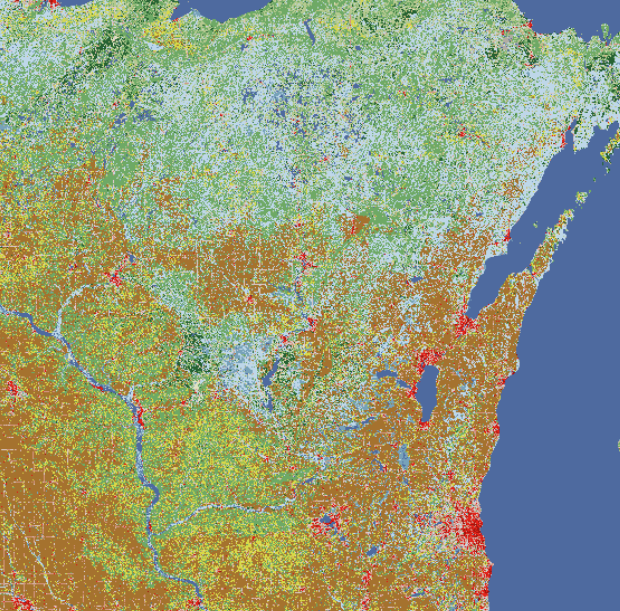
The Multi-Resolution Land Characteristics consortium provides users with high-resolution, longitudinal data on land cover, enabling them to track how landscapes have transformed over several decades. Tools like the NLCD Enhanced Visualization and Analysis (EVA) tool allow users to quantify specific environmental shifts, such as the conversion of agricultural land to urban development or the loss of wetlands within a given county. The RCMAP Rangeland Viewer offers insights into the health of grazing lands by breaking down fractional components like shrub, grass, and bare ground cover. Data can be visualized within the web viewers or downloaded. The MRLC Viewer can plot land use changes for a selected county over a period of decades.
User expertise rating:
Beginner to intermediate. Users can easily generate charts and graphics using straight-forward web navigation. Some expertise interpreting land-use and environmental data will allow users to get the most out of this resource.
Sample questions:
Between 2001 and 2021, how many acres of cultivated crops in a given county were converted to developed land classes? What is the percentage of impervious surface within a given watershed, and how has this percentage increased over the last ten years?