Social Vulnerability Interactive Map
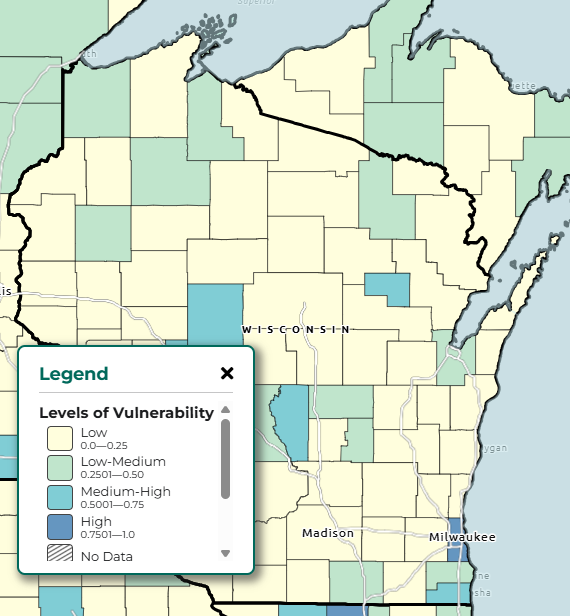
The Social Vulnerability Interactive (SVI) Map, a product of the CDC Agency for Toxic Substances and Disease Registry, displays vulnerability indices for four categories: socioeconomic status, household characteristics, racial and ethnic minority status, and housing type and transportation. Each of the four indices ranges from low to high in terms of the capacity of a community to respond to a hazardous event. Maps and reports can be generated for individual counties. The tool can also display point layers such as daycare facilities, nursing homes, schools, and hospitals.
User expertise rating:
Beginner to intermediate. The data layers in this resource are easy to navigate and well-defined. Some translation may be necessary to fully understand the presentation of indices rather than individual datasets.
Sample questions:
Which counties in Wisconsin have a low level of vulnerability to hazardous events based on their access to vehicles or lack of crowding within housing units? What about household characteristics such as a lack of English proficiency or disability status?