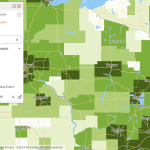
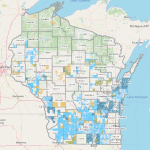
An example from the DATCP web maps

DATCP Web Maps

This list of web map applications from the WI Department of Agriculture, Trade, and Consumer Protection provides access to data on agricultural land-use designations and regulatory boundaries, allowing for highly localized technical assistance.

Read More...
Screenshot of a typical data visualization from DataUSA

DataUSA

DataUSA is a public-private partnership leveraging U.S. Census and other public data using a flexible dashboard generator for geographies including state, county, and municipality, and Tribal area. Topics include employment, industry, education, income, housing, transportation, poverty, and health.

Read More...
An example data comparison from Headwaters data profiles

Headwaters Data Profiles

Headwaters Economics is a nonprofit research group focusing on community development and land management. Offered here are a number of tools designed to assess various types of risk at the county or community level.

Read More...
An example figure from the Migration Data Hub.

Migration Data Hub

The Migration Data Hub provides comprehensive profiles and interactive maps detailing the demographics, geographic distribution, and socioeconomic characteristics of immigrant populations mostly at the state level, but some data is available at the county, and local levels.

Read More...
An example graph from the Census of Agriculture viewer

Census of Agriculture Viewer

The Census of Agriculture Viewer, developed by UW-Extension, can be used to explore data from the USDA Census of Agriculture between 2022 and 2002. The data is organized into 4 tabs: Farms, Demographics, Crops and practices, and Livestock.

Read More...
An example map from the Financial Security Indicators tool.

Financial Security Indicators

This resource, available only to logged-in wisc.edu users, provides a comprehensive suite of financial well-being indicators for Wisconsin, integrating data on assets, debt, employment, housing, income, and poverty from diverse sources.

Read More...
A screenshot of Eau Claire taken from OpenStreetMap.

OpenStreetMap

OpenStreetMap is a free and open geographic database of the built environment maintained and updated by a community of professionals and enthusiasts.

Read More...
Screenshot of a U.S. Census QuickFacts table.

US Census QuickFacts

The U.S. Census’ QuickFacts site provides a customizable table of common demographic and socio-economic statistics for the U.S., individual States and Counties, or cities and towns with populations of more than 5,000 people.

Read More...
Screenshot of PolicyMap with example data for Counties in Wisconsin.

PolicyMap

PolicyMap makes one of the most extensive lists of demographic and socio-economic variables accessible in one place—at nearly every level of geography imaginable. Current Census data exists alongside historical data of various types.

Read More...
An example of a map generated by StatsAmerica

StatsAmerica

StatsAmerica is an extensive and up-to-date collection of data and indices related to economic and community development. The site is also a handy source of Census and other federal data at the County, Place, or MSA level.

Read More...