The UW-Madison Applied Population Lab offers a tremendous breadth of interactive demographic and socio-economic tools, analyses, and reports. Some of these are detailed in this Data Inventory, but APL provides many more than can be listed here.
UW Extension’s Community Development Institute developed this comprehensive collection of data sources that are essential for communities to plan broadband implementations.
The Carbon Reduction Potential Evaluation Tool (CaRPE) is designed to explore historical and projected greenhouse gas mitigation potentials on agricultural lands resulting from the adoption of conservation practices.
The Center on Rural Innovation (CORI) Economic Development tool allows users to create a custom dashboard of indicators focused on the strengths and weaknesses of the selected area’s economy.
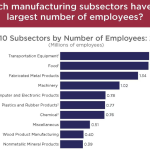
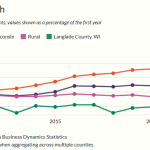
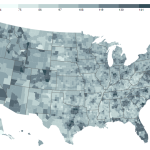
County Business Patterns, from the U.S. Census, provides economic data by industry and number of employees. The County-level data includes the number of establishments by NAICS code, number of employees by sector, and annual payroll by sector.
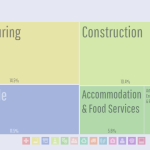
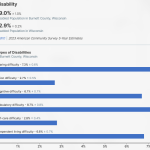
DataUSA is a public-private partnership leveraging U.S. Census and other public data using a flexible dashboard generator for geographies including state, county, and municipality, and Tribal area. Topics include employment, industry, education, income, housing, transportation, poverty, and health.
This list of web map applications from the WI Department of Agriculture, Trade, and Consumer Protection provides access to data on agricultural land-use designations and regulatory boundaries, allowing for highly localized technical assistance.
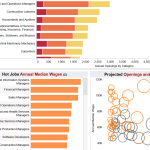
The Wisconsin Department of Workforce Development data dashboards provide comprehensive, localized economic and workforce data.

Statewide visualizations and maps can be generated on this site to examine topics such as businesses, industries, the labor force, unemployment, wages, and several others.
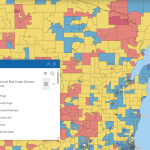
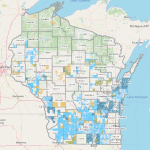
The Resilience Analysis and Planning Tool (RAPT) allows users to combine layers of community resilience indicators, infrastructure locations and hazard data. Users can visualize community resilience challenges to inform decisions around preparedness, mitigation, response and recovery.
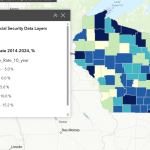
This resource, available only to logged-in wisc.edu users, provides a comprehensive suite of financial well-being indicators for Wisconsin, integrating data on assets, debt, employment, housing, income, and poverty from diverse sources.
APL’s Hmong Chartbook is the most detailed information source available in regard to the Hmong/HMoob population of Wisconsin.
This resource is instrumental in understanding labor market dynamics. LEHD data consists of job mobility, commuting characteristics, and quarterly workforce indicator datasets.
![Screenshot from the Map the Impact [of immigration] tool](https://fyi.extension.wisc.edu/programdevelopment/files/2026/01/MapTheImpact-150x150.png)
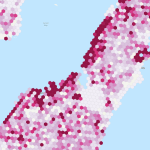
This census data visualization tool from the American Immigration Council centers on the economic impact of immigrants as found in ACS data. Topics include immigrant population share, taxes paid, spending power, number of entrepreneurs, and eligible voters.
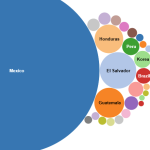
The Migration Data Hub provides comprehensive profiles and interactive maps detailing the demographics, geographic distribution, and socioeconomic characteristics of immigrant populations mostly at the state level, but some data is available at the county, and local levels.
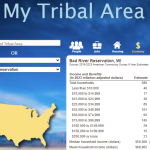
Finding data collected from Tribal Nation geographies can be challenging. This resource allows users to view statistics from the most current ACS aggregated and tabulated specifically to match the boundaries of the designated Tribal Geographies in Wisconsin.
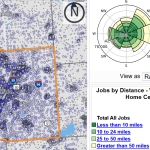
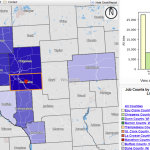
The Census Bureau’s OnTheMap application can be used to answer fundamental questions about the relationship between where people live and where they work.
PolicyMap makes one of the most extensive lists of demographic and socio-economic variables accessible in one place—at nearly every level of geography imaginable. Current Census data exists alongside historical data of various types.
The Bureau of Labor Statistics Quarterly Census of Employment and Wages is a highly reliable near-census of all jobs covered by unemployment insurance. The QCEW data is useful for determining county employment trends, identifying emerging job needs, targeting skills gaps, among other uses.
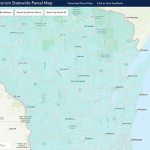
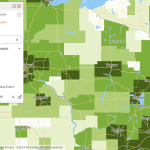
This resource aggregates local parcel datasets into a statewide file. The data includes typical attributes such as owner name, address, school district, assessed values, and property tax.
StatsAmerica is an extensive and up-to-date collection of data and indices related to economic and community development. The site is also a handy source of Census and other federal data at the County, Place, or MSA level.
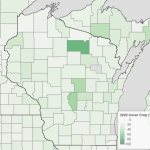
This resource shows production by county of specialty crops in categories such as fruits, tree nuts, novel oilseeds, and small grains, and the infrastructure needed to move crops from fields to consumers.
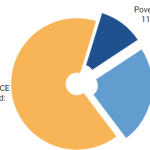
The United Way developed the ALICE (Asset Limited, Income Constrained, Employed) metric to examine the group of households earning more than the Federal Poverty Level, but not enough to afford the essentials for survival in the communities in which they reside.
The U.S. Census County Profiles offer a comprehensive and current socio-economic picture of each county in Wisconsin from economic, employment, and housing data to health, education, and demographics.
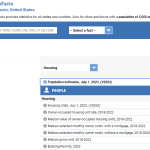
The U.S. Census’ QuickFacts site provides a customizable table of common demographic and socio-economic statistics for the U.S., individual States and Counties, or cities and towns with populations of more than 5,000 people.
The USDA conducts a census of U.S. farms and ranches at five year intervals looking at “land use and ownership, operator characteristics, production practices, income, and expenditures.”
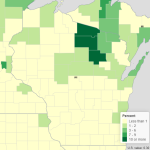
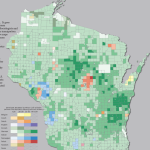
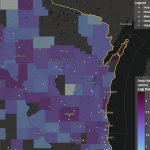
This resource offers a quick way to see the distribution of a number of variables from the 2022 USDA Census of Agriculture among the counties of Wisconsin.
The Net Migration tool from the UW Applied Population Lab allows users to access a migration profile for each Wisconsin County for the decade starting in 2010.