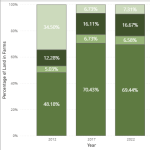
The Census of Agriculture Data Dashboard is a quick source of state-level data from 2012, 2017, or 2022. The data topics are high-level and include data about land in farms and producer demographics such as age, gender, and race/ethnicity.
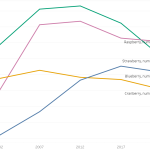
The Census of Agriculture Viewer, developed by UW-Extension, can be used to explore data from the USDA Census of Agriculture between 2022 and 2002. The data is organized into 4 tabs: Farms, Demographics, Crops and practices, and Livestock.
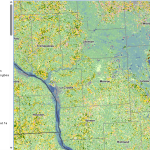
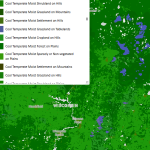
The CropScape portal interfaces with the USDA National Agricultural Statistics Service (NASS) Cropland Data Layer (CDL). CropScape uses remote sensing, ground truthing, and special algorithms to provide a comprehensive 30 x 30 meter census of land cover.
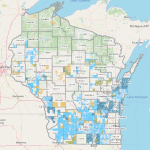
This list of web map applications from the WI Department of Agriculture, Trade, and Consumer Protection provides access to data on agricultural land-use designations and regulatory boundaries, allowing for highly localized technical assistance.
The Smart Location Database is designed to measure location efficiency—transportation costs and environmental impact, in particular. It includes more than 90 attributes summarizing characteristics such as housing density, diversity of land use, neighborhood design, destination accessibility, transit service, employment, and demographics.
This resource, access to which is limited to account holders (sign up is free), brings together geospatial data coordinated by several Federal Agencies. Topics include ecosystems, geology, soils, climate, cultural resources, transportation, and many others.
Headwaters Economics is a nonprofit research group focusing on community development and land management. Offered here are a number of tools designed to assess various types of risk at the county or community level.
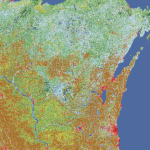
The Multi-Resolution Land Characteristics consortium provides users with high-resolution, longitudinal data on land cover, enabling them to track how landscapes have transformed over several decades.
OpenStreetMap is a free and open geographic database of the built environment maintained and updated by a community of professionals and enthusiasts.
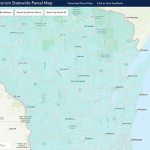
This resource aggregates local parcel datasets into a statewide file. The data includes typical attributes such as owner name, address, school district, assessed values, and property tax.
This resource shows production by county of specialty crops in categories such as fruits, tree nuts, novel oilseeds, and small grains, and the infrastructure needed to move crops from fields to consumers.
The USDA conducts a census of U.S. farms and ranches at five year intervals looking at “land use and ownership, operator characteristics, production practices, income, and expenditures.”
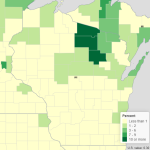
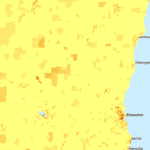
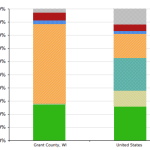
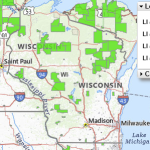
This resource offers a quick way to see the distribution of a number of variables from the 2022 USDA Census of Agriculture among the counties of Wisconsin.
The USDA Food Access Research Atlas and associated mapping tools provide county-level data identifying low-access areas by measuring the number of various types of food stores or markets by county and showing access indicators for different populations.
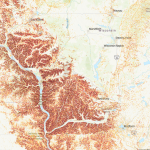
The USGS Landslide Inventory provides a comprehensive spatial database of documented landslides, including their locations, types, and movement characteristics.