Change in RFV and RFQ of Alfalfa During the Spring Growth
by Dan Undersander
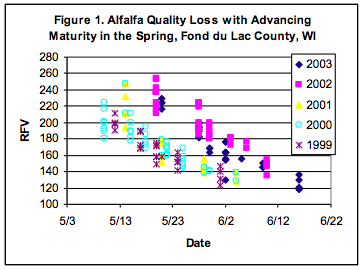
 We have used RFV to determine when to harvest first cutting for consistent quality for over 20 years. Alfalfa quality declines at a constant rate near harvest in the spring. However, as shown in figure 1, the lines of quality decline differ among years. If 180 RFV is the harvest quality goal, this point was reached on about May 18th in 1999 to 2001 but not until June 2nd in 2002 and 2003.
Thus, it is important to measure quality in the field before harvesting. The UW extension service, cooperating with many others, has coordinated a scissors clip program where forage was sampled, analyzed for quality and the results reported. More recently forage quality has been more easily estimated with the forage quality (PEAQ) stick. With this stick (or a yardstick) we measure the height of the alfalfa, determine the stage of the most mature stem, and estimate quality of the standing forage.
The value of digestible fiber for estimating energy of forages to better balance rations is well documented recommended by the National Research Council (NRC). To be consistent with NRC changes, we have changed from RFV, using fiber only, to Relative Forage Quality (RFQ) which uses the summative TDN (including digestible fiber) and adjusts intake for digestible fiber. Digestible fiber varies at similar fiber levels. RFV and RFQ will be the same when digestible fiber is average.  Since digestible fiber is usually higher than average on first cutting, the relationship between RFV and RFQ will not be constant among cuttings. However, our main concern is first cutting which is the usually the largest tonnage cutting and targeted for the dairy herd.
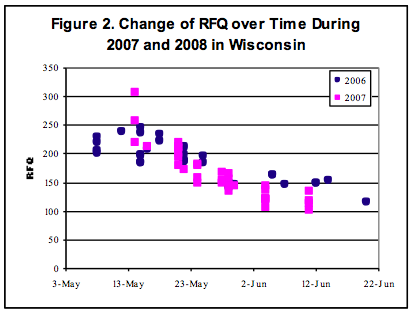
We ran analyses of scissors clip samples from multiple cuttings and sites to determine the relationship between the two indices. Figure 2 shows one important finding – that the rate of RFQ change was linear near harvest, as has been the case with RFV. This is significant because it allows the grower to project when forage will be ready to harvest based on the reading of any given day.
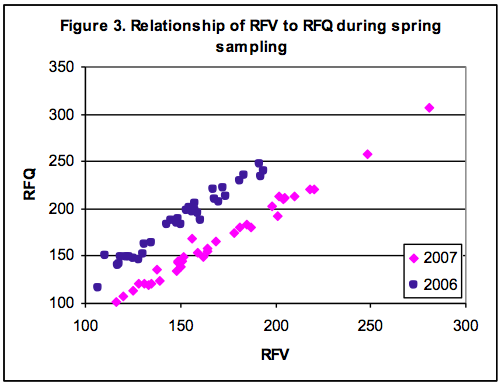
 The second goal of this effort was to determine the relationship between RFV and RFQ. The data in figure 3 shows the good relationship between RFV and RFQ since points for both years (the correlation was 0.99 for 2007 and 0.96 for 2006).
However, the relationship was not quite the same between years. In 2007 RFV and RFQ values were similar through the harvest range while in 2006 RFQ was 50 units higher than RFV. This would indicate that the fiber was generally more digestible in 2006 than 2007.
Thus, while RFQ is linearly related to RFV on first cutting (and often higher) the relationship of the two indices varies among years. While RFQ is often higher than RFV on first cutting, this is not necessarily so.
Greater accuracy can be achieved by analyzing a single forage sample to determine the Relative Forage Quality and then adjust assuming a change of 3.6 points decline per day.

 University of Wisconsin-Extension United States Department of
Agriculture Wisconsin Counties Cooperating and Providing Equal
Opportunities in Employment and Programming


