PolicyMap
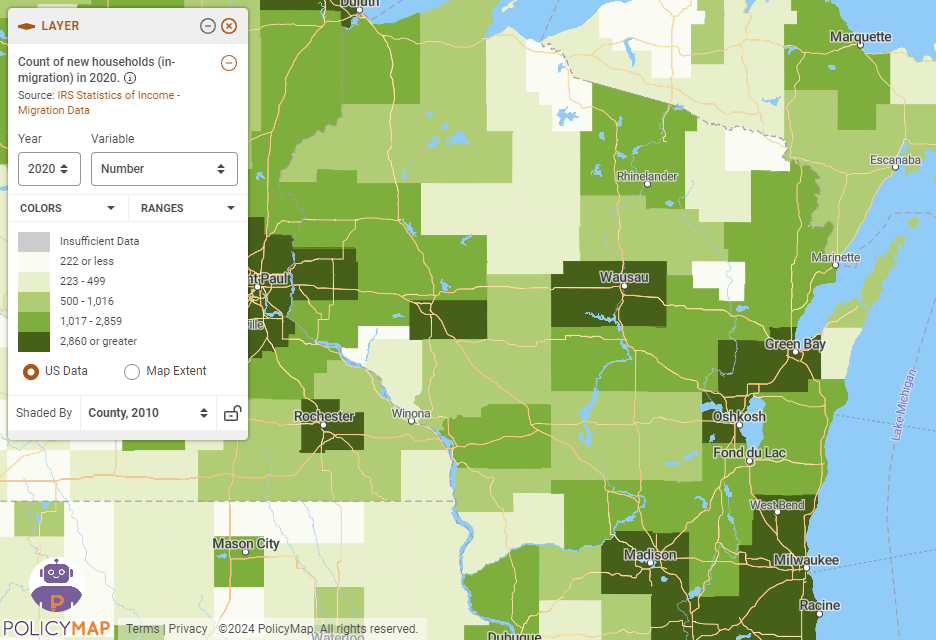
PolicyMap, available through the UW library system with a NetID login, makes one of the most extensive lists of demographic and socioeconomic variables accessible in one place—at nearly every level of geography imaginable. Current Census data exists alongside historical data of various types. Data can be displayed as interactive maps or tables, and customized reports can be generated from some data sets.
User expertise rating:
Beginner. This interactive resource allows the user to produce custom maps and reports using dropdown menus. The content consists of both familiar socioeconomic data and innovative indexes developed by PolicyMap.
Sample questions:
Which school districts contain the highest percentage of students recieving Free and Reduced Price lunch? From which Census Block Groups in Janesville can workers reach more than 20,000 jobs within a 45 minute commute by transit?


