USDA Food Access Research Atlas
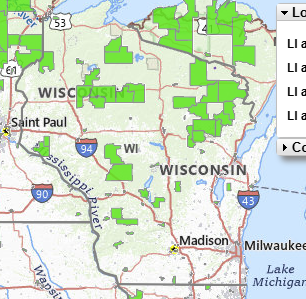
The USDA Food Access Research Atlas and associated mapping tools provide county-level data identifying low-access areas by measuring the number of various types of food stores or markets by county and showing access indicators for different populations. Census tracts can be identified as low-income and low-access based on resident proximity to the nearest supermarket. By layering socioeconomic indicators like vehicle availability, poverty rates, and age, these sites illustrate where geographic and financial barriers to healthy food are most acute.
User expertise rating:
Beginner. These interactive web maps are easily navigated with well-documented and comprehensive layers available.
Sample questions:
Which census tracts in a given county are classified as low income and low access at the 1-mile (urban) and 10-mile (rural) marks, and do our current program sites align with these high-need areas? In neighborhoods with low grocery access, what percentage of households lack access to a vehicle, suggesting a need for mobile markets or transit-oriented food solutions?