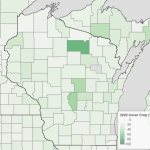
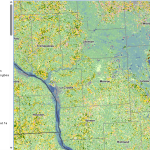
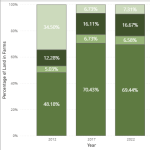
A sample map from the Carbon Reduction Potential Evaluation Tool

Carbon Reduction Potential Evaluation Tool

The Carbon Reduction Potential Evaluation Tool (CaRPE) is designed to explore historical and projected greenhouse gas mitigation potentials on agricultural lands resulting from the adoption of conservation practices.

Read More...
Example map of broadband access in Door County WI

Broadband Resources

UW Extension’s Community Development Institute developed this comprehensive collection of data sources that are essential for communities to plan broadband implementations.

Read More...
US Bureau of Labor Statistics logo

Quarterly Census of Employment and Wages

The Bureau of Labor Statistics Quarterly Census of Employment and Wages is a highly reliable near-census of all jobs covered by unemployment insurance. The QCEW data is useful for determining county employment trends, identifying emerging job needs, targeting skills gaps, among other uses.

Read More...
Example of the drought index for WI.

Drought Monitor

The U.S. Drought Monitor is a weekly snapshot of drought conditions, visualizing the severity of drought and where it is occurring.

Read More...
An example of the data available on the DWD dashboards

DWD Data Dashboards

The Wisconsin Department of Workforce Development data dashboards provide comprehensive, localized economic and workforce data.

Read More...
An example map from CDC PLACES

CDC PLACES

The data in the PLACES interactive tool is model generated by the Centers for Disease Control and Prevention (CDC) from various data sources. The map displays a comprehensive list of health related data from the county level down to the Census Tract level.

Read More...
An example of the data available on the US Census County Profiles site

US Census County Profiles

The U.S. Census County Profiles offer a comprehensive and current socio-economic picture of each county in Wisconsin from economic, employment, and housing data to health, education, and demographics.

Read More...
An example of the CropScape interface

CropScape

The CropScape portal interfaces with the USDA National Agricultural Statistics Service (NASS) Cropland Data Layer (CDL). CropScape uses remote sensing, ground truthing, and special algorithms to provide a comprehensive 30 x 30 meter census of land cover.

Read More...
A screenshot of the Supply Chain Infrastructure Map

Supply Chain Infrastructure Map

This resource shows production by county of specialty crops in categories such as fruits, tree nuts, novel oilseeds, and small grains, and the infrastructure needed to move crops from fields to consumers.

Read More...