The UW-Madison Applied Population Lab offers a tremendous breadth of interactive demographic and socio-economic tools, analyses, and reports. Some of these are detailed in this Data Inventory, but APL provides many more than can be listed here.
UW Extension’s Community Development Institute developed this comprehensive collection of data sources that are essential for communities to plan broadband implementations.
The Carbon Reduction Potential Evaluation Tool (CaRPE) is designed to explore historical and projected greenhouse gas mitigation potentials on agricultural lands resulting from the adoption of conservation practices.

The CDC National Health and Nutrition Examination Survey (NHANES) gathers detailed demographic, health behavior, medical condition, and nutrition information. The survey is unique in that it includes examination data and laboratory tests.
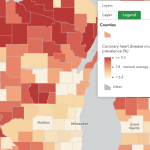
The data in the PLACES interactive tool is model generated by the Centers for Disease Control and Prevention (CDC) from various data sources. The map displays a comprehensive list of health related data from the county level down to the Census Tract level.
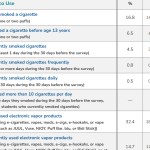
The CDC’s Youth Risk Behavior Surveillance System (YRBSS) monitors the prevalence of health-risk behaviors and experiences among U.S. high school students.
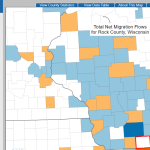
The Census Flow Mapper is an interactive mapping tool that shows the estimated number of people who moved into or out of a given County, and where they moved to or from.
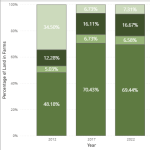
The Census of Agriculture Data Dashboard is a quick source of state-level data from 2012, 2017, or 2022. The data topics are high-level and include data about land in farms and producer demographics such as age, gender, and race/ethnicity.
The Census of Agriculture Viewer, developed by UW-Extension, can be used to explore data from the USDA Census of Agriculture between 2022 and 2002. The data is organized into 4 tabs: Farms, Demographics, Crops and practices, and Livestock.
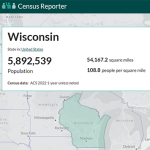
Census Reporter is a dashboard for visualizing Census data from the most current American Community Survey (ACS). Census geographies including State, County, and City can be selected using an interactive map.
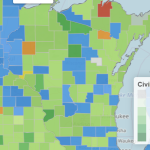
Leveraging IRS data and information scraped from organization websites, this resource from Johns Hopkins University illustrates the landscape of civic opportunity by county.
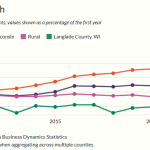
The Center on Rural Innovation (CORI) Economic Development tool allows users to create a custom dashboard of indicators focused on the strengths and weaknesses of the selected area’s economy.
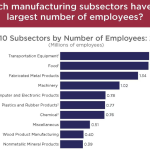
County Business Patterns, from the U.S. Census, provides economic data by industry and number of employees. The County-level data includes the number of establishments by NAICS code, number of employees by sector, and annual payroll by sector.
This website presents rankings by County across the U.S. of various health related topics in two categories: health factors, and health outcomes.
County Profiles, available exclusively to Extension colleagues with NetID login, contain data from public sources on each county in Wisconsin. Topics include demographics, health, employment, language, and economics.
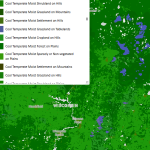
The CropScape portal interfaces with the USDA National Agricultural Statistics Service (NASS) Cropland Data Layer (CDL). CropScape uses remote sensing, ground truthing, and special algorithms to provide a comprehensive 30 x 30 meter census of land cover.
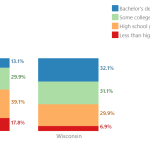
DataUSA is a public-private partnership leveraging U.S. Census and other public data using a flexible dashboard generator for geographies including state, county, and municipality, and Tribal area. Topics include employment, industry, education, income, housing, transportation, poverty, and health.
This list of web map applications from the WI Department of Agriculture, Trade, and Consumer Protection provides access to data on agricultural land-use designations and regulatory boundaries, allowing for highly localized technical assistance.
The DHS Open Data Portal provides an extensive list of data related to health and behavior including: birth and death rates, life expectancy, illness, insurance, public health, lead, mental health, and substance use.
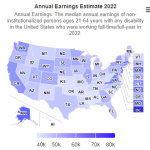
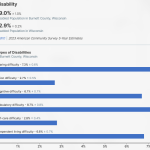
Disability Statistics is a state-level database designed to provide policy makers, advocates, journalists, and the public with access to demographic and socio-economic statistics on the non-institutionalized population of the U.S. with disabilities.
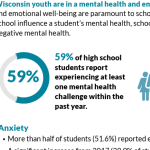
The Wisconsin Youth Risk Behavior Survey (YRBS) has been conducted every two years since 1993. The health-risk behaviors monitored include mental health, traffic safety, weapons and violence, suicide, tobacco use, alcohol and other drug use, sexual behavior, nutrition, and exercise.

The Kids Count Data Center provides a convenient source of Department of Health Services, Department of Public Instruction, U.S. Census, and other data. Tables or maps for many socio-economic indicators that affect the lives of children and adults can be generated and downloaded.
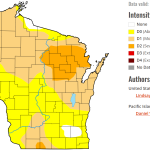
The U.S. Drought Monitor is a weekly snapshot of drought conditions, visualizing the severity of drought and where it is occurring.
The Wisconsin Department of Workforce Development data dashboards provide comprehensive, localized economic and workforce data.

Statewide visualizations and maps can be generated on this site to examine topics such as businesses, industries, the labor force, unemployment, wages, and several others.
The Smart Location Database is designed to measure location efficiency—transportation costs and environmental impact, in particular. It includes more than 90 attributes summarizing characteristics such as housing density, diversity of land use, neighborhood design, destination accessibility, transit service, employment, and demographics.
EJScreen, the EPA’s Environmental Justice Screening and Mapping Tool is designed to highlight places that may have more exposure to health-impacting environmental risks and under-resourced or more vulnerable populations.
The EPD maps five categories of socioeconomic and demographic Census data at the County, County Subdivision, Tract, and Block Group levels, and includes a number of community assets for additional local context.
The Resilience Analysis and Planning Tool (RAPT) allows users to combine layers of community resilience indicators, infrastructure locations and hazard data. Users can visualize community resilience challenges to inform decisions around preparedness, mitigation, response and recovery.
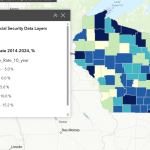
This resource, available only to logged-in wisc.edu users, provides a comprehensive suite of financial well-being indicators for Wisconsin, integrating data on assets, debt, employment, housing, income, and poverty from diverse sources.
This resource, access to which is limited to account holders (sign up is free), brings together geospatial data coordinated by several Federal Agencies. Topics include ecosystems, geology, soils, climate, cultural resources, transportation, and many others.
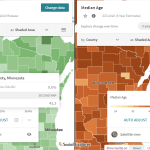
APL’s GetFacts is a tool for generating demographic profiles of Wisconsin Counties, County Subdivisions, or the State with a focus on population trends, health, housing, race and ethnicity, economics, or civil rights.
Headwaters Economics is a nonprofit research group focusing on community development and land management. Offered here are a number of tools designed to assess various types of risk at the county or community level.
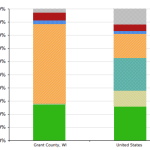
APL’s Hmong Chartbook is the most detailed information source available in regard to the Hmong/HMoob population of Wisconsin.
The Kids Count Data Center provides a convenient source of DHS, DPI, U.S. Census, and other data. Tables or maps for many socio-economic indicators that affect the lives of children and adults are available.
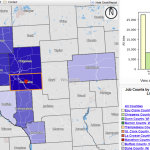
This resource is instrumental in understanding labor market dynamics. LEHD data consists of job mobility, commuting characteristics, and quarterly workforce indicator datasets.
Data Interactives is a resource developed by UCLA to provide information about LGBT people in the U.S.
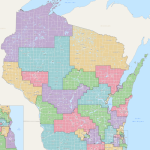
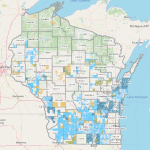
The LTSB is the state’s authoritative source of legislative district information, and information about state representatives. Products available for download include district maps, election data, and redistricting data.
![Screenshot from the Map the Impact [of immigration] tool](https://fyi.extension.wisc.edu/programdevelopment/files/2026/01/MapTheImpact-150x150.png)
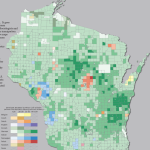
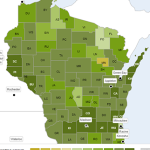
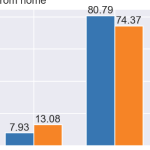
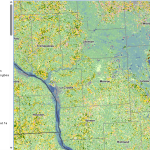
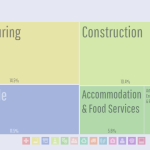
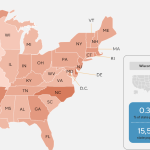
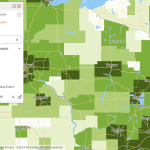
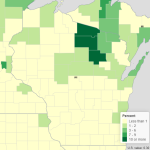
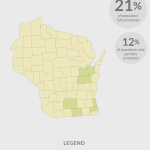
This census data visualization tool from the American Immigration Council centers on the economic impact of immigrants as found in ACS data. Topics include immigrant population share, taxes paid, spending power, number of entrepreneurs, and eligible voters.
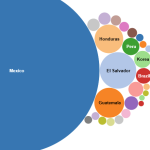
The Migration Data Hub provides comprehensive profiles and interactive maps detailing the demographics, geographic distribution, and socioeconomic characteristics of immigrant populations mostly at the state level, but some data is available at the county, and local levels.
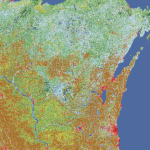
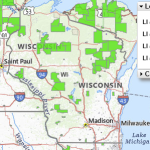
The Multi-Resolution Land Characteristics consortium provides users with high-resolution, longitudinal data on land cover, enabling them to track how landscapes have transformed over several decades.
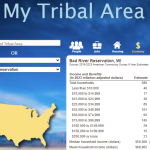
Finding data collected from Tribal Nation geographies can be challenging. This resource allows users to view statistics from the most current ACS aggregated and tabulated specifically to match the boundaries of the designated Tribal Geographies in Wisconsin.
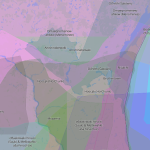
Native Land Digital is an evolving and Indigenous-led educational tool designed to support Indigenous self-determination, visibility, and connection.
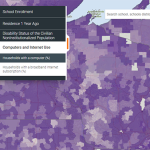
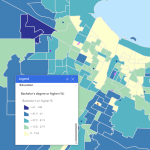
The ACS-ED interactive mapping tool allows the user to visualize socio-economic and demographic variables from the U.S. Census ACS by school district.
The Neighborhood Atlas, featuring the Area Deprivation Index, ranks census blocks based on socioeconomic disadvantage by aggregating 17 indicators related to income, education, employment, and housing quality. The Atlas can be a resource for precisely tailoring programs for areas where high levels of disadvantage may intersect with other needs.
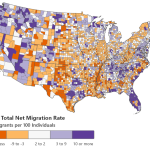
APL’s Net Migration Patterns is an interactive map showing the migration into and out of U.S. Counties disaggregated by age and race/ethnicity.
In this document the UW-Extension Office of Access, Inclusion, and Compliance (OAIC) consolidates dozens of disparate federal and state data sources into a single, organized directory for rapid assessment.
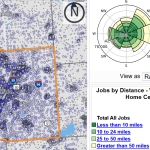
The Census Bureau’s OnTheMap application can be used to answer fundamental questions about the relationship between where people live and where they work.
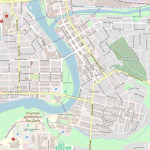
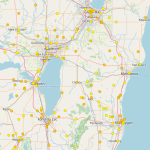
OpenStreetMap is a free and open geographic database of the built environment maintained and updated by a community of professionals and enthusiasts.
PolicyMap makes one of the most extensive lists of demographic and socio-economic variables accessible in one place—at nearly every level of geography imaginable. Current Census data exists alongside historical data of various types.
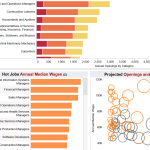
The Bureau of Labor Statistics Quarterly Census of Employment and Wages is a highly reliable near-census of all jobs covered by unemployment insurance. The QCEW data is useful for determining county employment trends, identifying emerging job needs, targeting skills gaps, among other uses.
The Social Explorer, available with a UW NetID login, allows the user to access and map an extensive list of demographic, socio-economic, health, environmental, business, and election data sets.
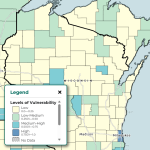
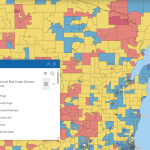
The Social Vulnerability Interactive (SVI) Map, a product of the CDC Agency for Toxic Substances and Disease Registry, displays vulnerability indices for four categories: socioeconomic status, household characteristics, racial and ethnic minority status, and housing type and transportation.
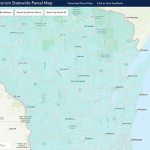
This resource aggregates local parcel datasets into a statewide file. The data includes typical attributes such as owner name, address, school district, assessed values, and property tax.
StatsAmerica is an extensive and up-to-date collection of data and indices related to economic and community development. The site is also a handy source of Census and other federal data at the County, Place, or MSA level.
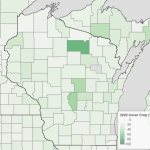
This resource shows production by county of specialty crops in categories such as fruits, tree nuts, novel oilseeds, and small grains, and the infrastructure needed to move crops from fields to consumers.
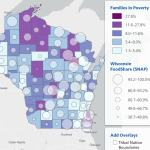
APL’s Wisconsin Food Security Project provides data to help identify food security strengths, risk factors, and gaps via socio-economic factors.
APL’s Wisconsin Risk and Reach Project assesses potential gaps between publicly funded programs and community risks especially as they relate to children and families.
The United Way developed the ALICE (Asset Limited, Income Constrained, Employed) metric to examine the group of households earning more than the Federal Poverty Level, but not enough to afford the essentials for survival in the communities in which they reside.
The U.S. Census County Profiles offer a comprehensive and current socio-economic picture of each county in Wisconsin from economic, employment, and housing data to health, education, and demographics.
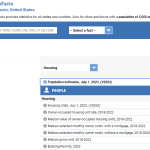
The U.S. Census’ QuickFacts site provides a customizable table of common demographic and socio-economic statistics for the U.S., individual States and Counties, or cities and towns with populations of more than 5,000 people.
The U.S. DOT’s Fatality and Injury Reporting System Tool (FIRST) allows users to query both the Fatality Analysis Reporting System (FARS) and the Crash Report Sampling System (CRSS) using various attributes of crashes on the state’s roadways.
The USDA conducts a census of U.S. farms and ranches at five year intervals looking at “land use and ownership, operator characteristics, production practices, income, and expenditures.”
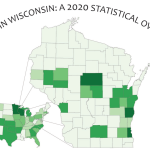
This resource offers a quick way to see the distribution of a number of variables from the 2022 USDA Census of Agriculture among the counties of Wisconsin.
USDA farmers.gov county dashboards pull together current data on commodity prices, weather, and USDA Programs.
The USDA Food Access Research Atlas and associated mapping tools provide county-level data identifying low-access areas by measuring the number of various types of food stores or markets by county and showing access indicators for different populations.
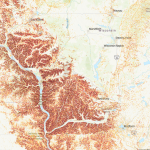
The USGS Landslide Inventory provides a comprehensive spatial database of documented landslides, including their locations, types, and movement characteristics.
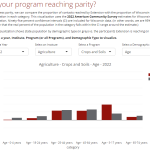
The Parity Visualizer allows users to observe the extent to which UW Extension programing is reaching the population of Wisconsin by comparing the demographics of participants with those of the state.
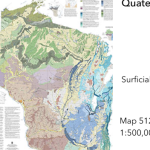
This resource from the Wisconsin Geologic and Natural History Survey conveniently gathers a large number of maps and spatial resources in one place. Click on the map to find resources by geographic area or browse by topic.
The Net Migration tool from the UW Applied Population Lab allows users to access a migration profile for each Wisconsin County for the decade starting in 2010.
This site contains statistics related to Wisconsin’s L.G.B.T.Q. population including information about relevant policy.