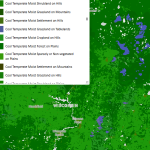
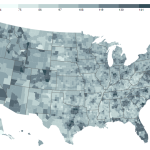
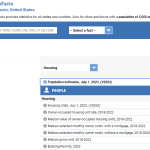
This website presents rankings by County across the U.S. of various health related topics in two categories: health factors, and health outcomes.
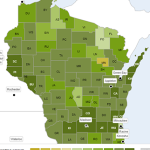
The Wisconsin Department of Workforce Development data dashboards provide comprehensive, localized economic and workforce data.
The Smart Location Database is designed to measure location efficiency—transportation costs and environmental impact, in particular. It includes more than 90 attributes summarizing characteristics such as housing density, diversity of land use, neighborhood design, destination accessibility, transit service, employment, and demographics.
EJScreen, the EPA’s Environmental Justice Screening and Mapping Tool is designed to highlight places that may have more exposure to health-impacting environmental risks and under-resourced or more vulnerable populations.
This resource, access to which is limited to account holders (sign up is free), brings together geospatial data coordinated by several Federal Agencies. Topics include ecosystems, geology, soils, climate, cultural resources, transportation, and many others.
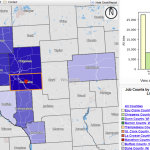
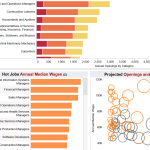
This resource is instrumental in understanding labor market dynamics. LEHD data consists of job mobility, commuting characteristics, and quarterly workforce indicator datasets.
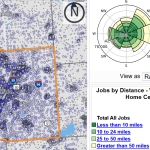
The Census Bureau’s OnTheMap application can be used to answer fundamental questions about the relationship between where people live and where they work.
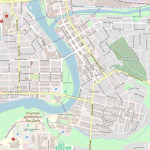
OpenStreetMap is a free and open geographic database of the built environment maintained and updated by a community of professionals and enthusiasts.
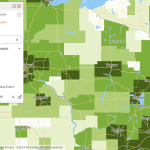
PolicyMap makes one of the most extensive lists of demographic and socio-economic variables accessible in one place—at nearly every level of geography imaginable. Current Census data exists alongside historical data of various types.
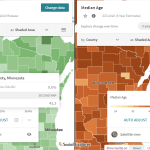
The Social Explorer, available with a UW NetID login, allows the user to access and map an extensive list of demographic, socio-economic, health, environmental, business, and election data sets.
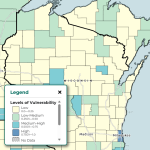
The Social Vulnerability Interactive (SVI) Map, a product of the CDC Agency for Toxic Substances and Disease Registry, displays vulnerability indices for four categories: socioeconomic status, household characteristics, racial and ethnic minority status, and housing type and transportation.
StatsAmerica is an extensive and up-to-date collection of data and indices related to economic and community development. The site is also a handy source of Census and other federal data at the County, Place, or MSA level.
The U.S. Census’ QuickFacts site provides a customizable table of common demographic and socio-economic statistics for the U.S., individual States and Counties, or cities and towns with populations of more than 5,000 people.
The U.S. DOT’s Fatality and Injury Reporting System Tool (FIRST) allows users to query both the Fatality Analysis Reporting System (FARS) and the Crash Report Sampling System (CRSS) using various attributes of crashes on the state’s roadways.
The USDA Food Access Research Atlas and associated mapping tools provide county-level data identifying low-access areas by measuring the number of various types of food stores or markets by county and showing access indicators for different populations.