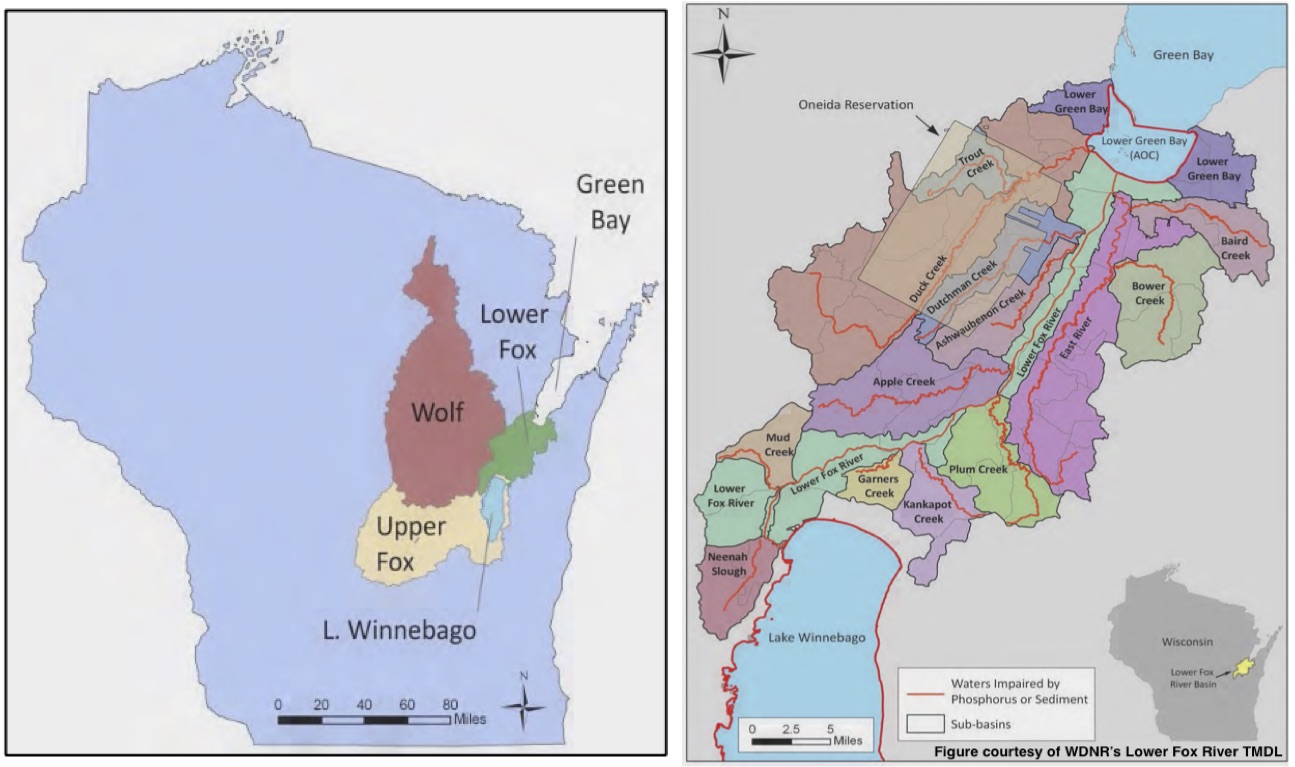
In northeast Wisconsin, agriculture is not the only source of non-point pollution; however, it is the largest source. In the 2012 Total Maximum Daily Load and Watershed Management Plan for the Lower Fox River Basin and Lower Green Bay, the baseline sources of total phosphorus (TP) and total suspended solids (TSS) for Lower Green Bay were identified. To build a comprehensive understanding of the factors contributing to TP and TSS loading, the study looked at total loading from the three prominent river basins (Lower Fox River, Upper Fox River (including Lake Winnebago), and the Wolf River) (Figure 1), as well as specific sources from the Lower Fox River Watershed (Figure 1).
Results:
The results of the study show that while there are several factors contributing to nutrient and sediment pollution in Lower Green Bay, agriculture is the primary source for both TP and TSS. These results will help land owners, resource managers, and community leaders focus their efforts and resources to develop a long-term plan that will help address these issues in the most effective and efficient way possible.
The good news is that there are farming practices that can restore soil health, reduce runoff pollution, and improve water quality, all while supporting a strong regional economy. The Fox Demo Farms Network is working to identify which conservation practices are most effective and feasible in northeast Wisconsin.
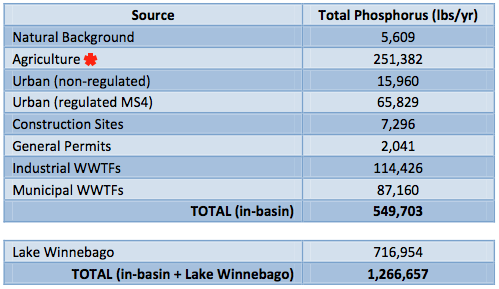
Total Phosphorus:
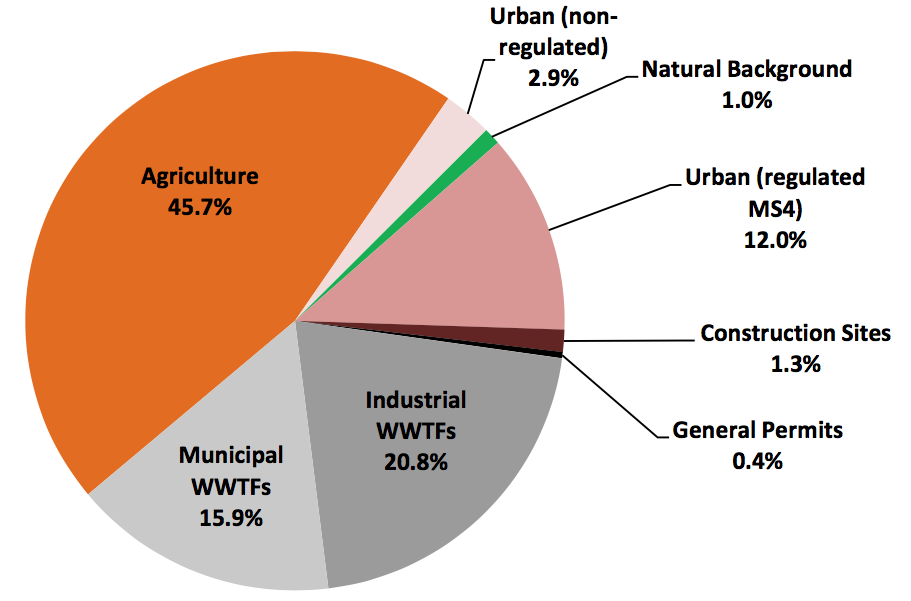
Average annual total phosphorus (TP) loading into Lower Green Bay from the Lower Fox River Watershed is an estimated 549,703 lbs./year, which is approximately 43 percent of the annual total phosphorus deposited into Lower Green Bay (Figure 3). Note that agriculture in the Lower Fox River Basin annually contributes 251,382 pounds of TP to Lower Green Bay (Figure 3), which represents nearly 46 percent of the Lower Fox River Basin’s annual TP loading (Figure 4).
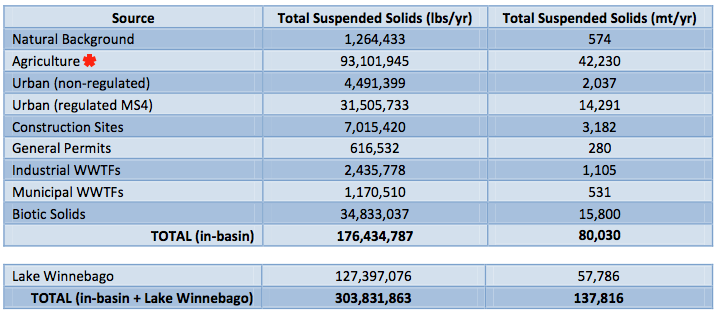
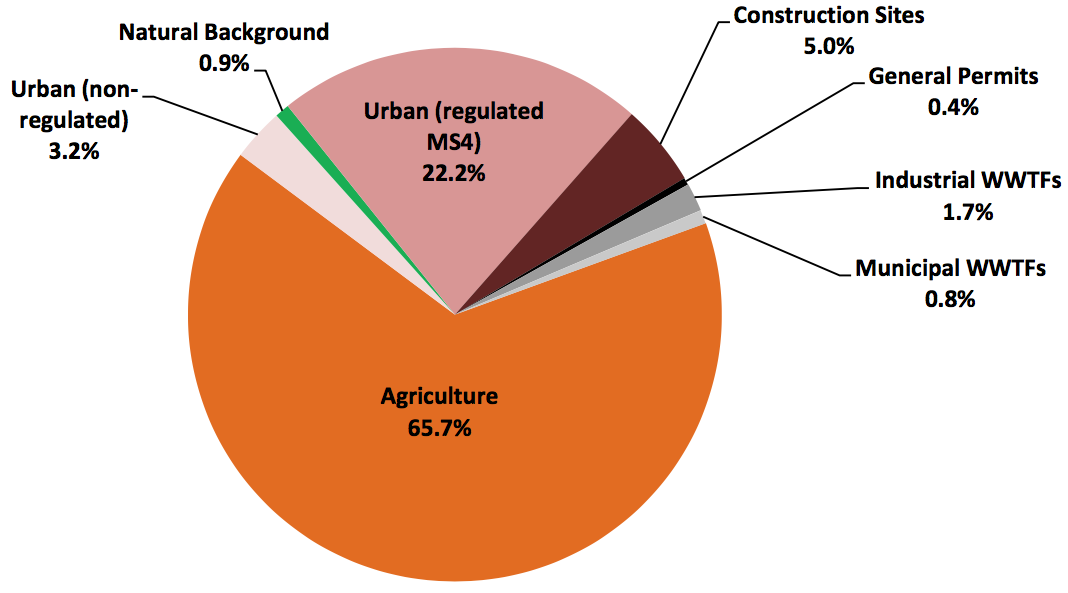
Total Suspended Solids:
Average annual total suspended solids (TSS) into Lower Green Bay from the Lower Fox River Basin is an estimated 176,434,787 lbs./year, which is approximately 58 percent of the annual TSS deposited into Lower Green Bay (Figure 5). Note that agriculture in the Lower Fox River Basin annually contributes 93,101,945 pounds of TSS to Lower Green Bay (Figure 5), which represents nearly 66 percent of the Lower Fox River Basin’s annual TSS loading (Figure 6).